


UV Technology for Automation and Process Integration
UV process integration means embedding ultraviolet radiation sources and the associated measurement technology into automated production sequences, so that the radiation is no longer treated as an equipment state but managed as a controlled and documented process variable. The technical goal is a reproducible photochemical or photobiological effect – curing, surface activation, disinfection, fluorescence excitation – under varying cycle times, source ageing and part geometry.
What matters is not lamp power or operating hours, but the irradiance E in W/m² actually arriving at the point of action, the radiant exposure H in J/m² integrated from it over time, the spectral distribution of the source and the temporal resolution of the measurement. The central challenge is to capture these quantities in the running process with a known measurement uncertainty and to hand them over to the controller in machine-readable form.

How are the market and technology developing?
For the field of “UV measurement in automated processes” there is no standalone, reliable market figure. Three adjacent markets serve as indicators, and they must be kept strictly apart methodically; adding them up is inadmissible because of double counting.
The market for UV curing systems is quantified very differently depending on scope: USD 6.71 billion (2025) with a 17.12 % CAGR to 2031 when equipment and materials are counted, versus USD 2.78 billion (2025) with an 8.3 % CAGR to 2032 for systems without materials. Both values are plausible – they measure different things. More relevant to the automation question than the absolute figure is the structural finding that in 2025 already 46.6 % of systems were fully automated and inline or production-integrated systems reached a volume of USD 927.1 million.
The industrial automation market for 2025 is put at between USD 221.64 billion and USD 272.51 billion at a 9.80 % CAGR, with a 32.99 % European share; industrial sensing, at roughly USD 30 billion and about 9 % CAGR, is the most consistent reference market. The UV sensor market itself is barely usable as an indicator: figures scatter between USD 192.68 million (2024) and USD 5.81 billion (2025) – a factor of more than 25, because none of the studies examined defines whether sensor chips, radiometers or measurement systems are being counted.
The technological shift is better documented than the market size. Mercury lamps still hold about half of the revenue (52.42 % or 49.2 % for 2025), while more than 55 % of newly shipped systems are LED-based – installed-base revenue and new-installation share must be kept apart here. On the regulatory side, the RoHS exemption for mercury UV curing lamps has been extended only until early 2027.
The causal chain is thus easy to follow: the transition to narrowband LED sources and higher degrees of automation brings pulsed operation, shorter cycle times and segmented emitter arrays – and thereby raises the demands on measurement. A broadband sensor that was used on a mercury lamp is no longer readily valid on a 385 nm LED, and a sampling rate that was sufficient at 25 m/min misses the irradiance peak at 120 m/min.
First, control is shifting from the manipulated variable to the target variable. Instead of lamp power, the dose arriving at the substrate is controlled – in series products with 128 samples/s (too few for fast webs, see worked example below), 1 mW/cm² resolution and a target value of 50 mJ/cm² ± 10 %, in pilot operation with a sensor moved across the working width and test operation up to 250 m/min.
Second, the efficiency of UV-C LEDs is rising by leaps: 200 mW at 265 nm with 10.2 % wall-plug efficiency, PTB-validated, compared with 5.3 % for the predecessor. This shifts the economic threshold relative to mercury lamps, while far-UVC at 222 nm remains at around 1 %.
Third, self-description of field devices is becoming the expectation – driven by IO-Link, OPC UA FX and the Asset Administration Shell. Fourth, IEC TR 63381:2025 for the first time provides guidance on field inspection of UV emission, addressing unstable mains voltage, temperature and emitters with unknown ageing state.
Caution is warranted with three terms: at UV equipment manufacturers, “predictive maintenance” predominantly means condition monitoring with an operating hours counter and threshold alarm; “digital twins” of UV systems exist so far as cloud data mirrors, not as simulation-coupled models; and for “AI-assisted curing” no radiometric traceability of the actual irradiance is documented – the control loop closes via job data and user feedback.
How is UV radiation measured in industrial processes?
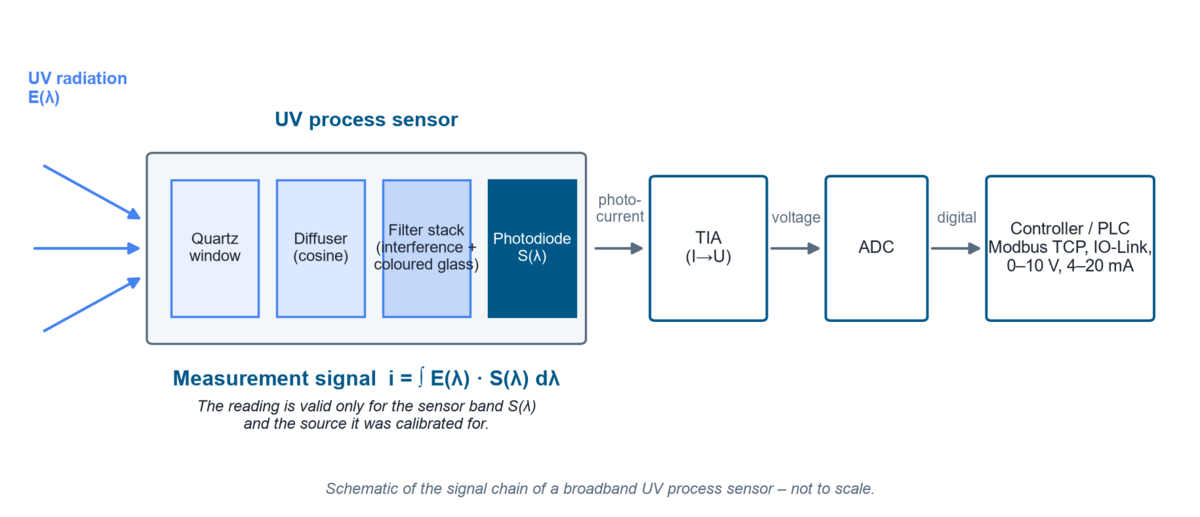
Industrial UV sensing is based on the internal photoelectric effect: photons with sufficient energy generate charge carrier pairs in the semiconductor, and the resulting photocurrent is converted to a voltage by a transimpedance amplifier and digitised. A broadband process sensor consists of an entrance window (usually quartz glass, since soda-lime glass is practically opaque below about 300 nm), a diffuser to establish the cosine response, a filter stack of interference and coloured-glass filters, the detector and the signal chain. The output signal is not a “UV value” but the integral
i = ∫ E(λ) · S(λ) dλ
over the products of spectral irradiance and the sensor's realised spectral responsivity S(λ). Every reading is therefore valid only in connection with the sensor band and the source for which it was calibrated. How UV sensors are built and what determines their spectral responsivity is shown in detail on the page How UV Sensors Work.
Which technologies are used?
On the detector side, four principles compete. Silicon photodiodes are the standard and need a filter stack for UV selectivity; silicon carbide is gaining ground in the UV-C because it is inherently insensitive to visible light. AlGaN detectors offer tunable band edges but degrade considerably more under process conditions. Spectroradiometers resolve the wavelength distribution and avoid spectral mismatch, but are slower and more elaborate.
| Technology | Characteristics | Advantages | Limitations | Typical application |
|---|---|---|---|---|
| Si photodiode with filter stack | broadband, band position defined by interference and coloured-glass filters | high responsivity, linear, low-cost, µs time constant | filter-dependent; types not optimised for UV lose nearly all responsivity at 200 nm, UV-optimised ones less than 5–6 % | inline monitoring of UV-A/UV-B in curing and printing |
| SiC photodiode | intrinsically visible-blind, wide bandgap | 90 h at 60 mW/cm² and 80 °C without measurable degradation; at 350 °C only −12 % in the first 120 h, stable thereafter | lower responsivity; 120 h burn-in needed before baseline | UV-C disinfection, hot curing tunnels |
| AlGaN photodiode | band edge tunable via Al content | spectrally selective without an additional filter stack | in the same test approx. −85 % loss of responsivity after 90 h at 60 mW/cm² and 80 °C, hence limited under high UV and temperature load | narrowband special solutions with a defined band edge at moderate temperature and dose load |
| Spectroradiometer | wavelength-resolved measurement 200–1100 nm | avoids spectral mismatch, enables mismatch correction to CIE 220:2016 | slower, more expensive, rarely inline-capable | reference measurement, sensor adjustment, source characterisation |
On the source side, medium-pressure mercury lamps (broadband UV-C to UV-A, 400 W to 24 kW) and low-pressure lamps (approx. 254 nm, UV yield up to about 40 %) face the narrowband UV LEDs at 365, 385, 395 and 405 nm. The choice of source directly determines the demands on the sensor: the narrower the emission spectrum, the more sensitively a broadband sensor reacts to mismatch.
Which process variables are decisive?
Irradiance E (W/m²) is the instantaneous power density at the point of action and decides whether a photoreaction starts at all – in free-radical polymerisation a minimum irradiance is a threshold condition.
Radiant exposure H (J/m², industrially “dose”) is the time integral H = ∫ E(t) dt and determines the degree of conversion achieved. For conversion: 10 W/m² correspond to 1 mW/cm². A process window must therefore always be specified in two dimensions – with Emin/Emax and Hmin/Hmax.
Spectral distribution: Since the effect is wavelength-dependent and the sensor weights spectrally, a reading without a stated spectral band cannot be interpreted.
Sampling rate and integration time: Metrologically, the dose arises as a sum of discrete samples; its quality is directly a function of the sampling rate.
Geometry and distance: The inverse square law holds only approximately for sources acting as point sources; as a rule of thumb, r ≥ 10 · d should be observed, where d is the largest dimension of the emitting area. Readings at smaller distances are valid, but must not be converted via 1/r².
Temperature acts on both sides: UV-C LEDs show temperature coefficients of radiant power between −0.8 %/K and +0.4 %/K, and for every 10 °C rise in junction temperature the L70 lifetime halves.
What limits the process or leads to errors?
The most common fallacy is equating electrical power with optical dose. Between power consumption and effect at the part lie conversion efficiency, source ageing, reflector contamination, window transmission, distance and angle of incidence. It is documented, for instance, that some UV-C LED types drop to 50–70 % of their initial value within roughly the first 100 operating hours without being defective, while good components still deliver 90–95 % after 1,000 h – which is why the baseline should only be measured after a 100–200 h run-in period.
A plain time specification is equally insufficient. H = E · t presumes a temporally constant irradiance – a condition not met with ageing lamps, PWM dimming and moving substrates.
The third typical misconception concerns the measurement location. A measurement beside the process location captures neither shadowing by the part nor the actual bondline geometry. Conversely, a measurement bar in the beam path itself interferes with the process: at 13 mm distance, 4.83 % energy loss and a 13.85 % drop in peak irradiance were measured, at 38 mm only 0.8 % and 2.3 % respectively.
Finally, the ageing of the measuring device itself is underestimated. Solarisation discolours glasses, photodarkening lowers the transmission of coloured-glass filters uniformly across the spectrum, and hydrocarbons polymerise under UV on optical surfaces; a mere 8 h at 253.7 nm and only 10.5 µW/cm² raised the dark current of a Si photodiode by 10.2 %. A permanently installed sensor without periodic reference checks therefore inevitably shifts the documented process window.
How do material, spectrum and geometry interact?
Spectral mismatch is often the largest single contribution to measurement uncertainty with narrowband sources. Comparison measurements with four freshly calibrated radiometers on UV LEDs yielded about ±5 % with a spectrally matched instrument, but deviations of 9 to 91 % with an unsuitable band – specifically an underestimation of 65 % at 385 nm and an overestimation of more than 40 % at 405 nm. Association literature quotes an underestimation of around 75 % for a UV-A sensor centred at 375 nm on a 395 nm system. For broadband sources, CIE 220:2016 quantifies the same problem via mismatch factors: a 1.5 % spread across the CIE reference spectra, but a factor of 1.377 for low-pressure and 1.360 for medium-pressure mercury.
Normative band, sensor band, manufacturer band
The band limits themselves are not unambiguous. The CIE defines UV-A as 315–400 nm and explicitly notes that a precise boundary between UV and visible radiation cannot be defined. ISO 20473:2007, by contrast, limits UV-A to 315–380 nm and itself refers in a footnote to the deviating 400 nm boundary. Sunscreen standards set the UV-A/UV-B boundary at 320 instead of 315 nm. The same label “UVA” can consequently mean 315–400, 315–380, 320–400, 320–390 or – defined via 10 % points – 309–367 nm.
The special case of 405 nm shows the practical consequence: normatively this wavelength lies in the visible violet range, industrially it is treated as a UV curing wavelength. ISO 3059 even requires a relative responsivity below 2 % at 405 nm for UV-A meters in penetrant testing – the same wavelength is useful radiation in curing and stray radiation in non-destructive testing. Manufacturer bands such as UVA+ (330–455 nm) or UVBB (230–400 nm) are deliberately process-matched and expressly not normative. An overview of the spectral ranges and their normative limits is given on the page Guidelines, norms and standards in UV.
Photon energy, dose integral and reciprocity
The effectiveness of a UV source starts with the energy of the individual photon:
EPh = h · c / λ
where h = Planck constant, c = speed of light and λ = wavelength.
At 365 nm this corresponds to around 3.4 eV, at 254 nm to around 4.9 eV. Only photons above the activation threshold of a photoinitiator or above the absorption band of DNA trigger the desired reaction – which is why the same irradiance at a different wavelength delivers completely different process results. The same energy scale explains why photoionisation detectors have to work in the vacuum UV at 8.4 to 10.6 eV.
The second core equation is the dose integral H = ∫ E(t) dt. The widespread simplification H = E · t corresponds to the Bunsen-Roscoe reciprocity principle: the same dose is supposed to produce the same effect, regardless of how it is split between intensity and time. The preconditions are a temporally constant irradiance and a linear, non-saturating photoreaction. For sunbeds, this special case is explicitly permitted only “after lamp burn-in and under constant operating conditions”.
Model limits: In free-radical polymerisation, reciprocity does not hold throughout, because a minimum irradiance conditions the start of the reaction and oxygen inhibition as well as heat input act intensity-dependently. A documented comparison shows this quantitatively: a 365 nm system with 21 ms pulses, 85 % duty cycle and 460 mW/cm² peak reached 10 J/cm² in 25 s at 40 °C substrate temperature, while CW operation at 520 mW/cm² required 14 J/cm² and 65 °C – above 220 mW/cm² CW, substrate damage occurred. Less dose led to the better result here; the plain product E · t would have suggested the wrong design.
Practical consequence: With pulsed sources, the dose must be captured as a true time integral with a documented sampling rate, and the process record must state CW mean, peak value and dose separately. At identical energy density, a meter can display strongly differing peak values depending on sampling – both values are formally correct, but differently defined.
Worked example: what sampling rate does a web line need?
Assumptions: LED array with L = 25 mm window length in the web direction, web speed v = 120 m/min = 2 m/s. N = 20 samples are required within the irradiation zone; below five samples, peak capture is considered critical.
Model: fs ≳ N · v / L
Calculation: fs ≥ 20 · 2 m/s / 0.025 m = 1,600 Hz
Result and interpretation: At least around 1,600 Hz are required; the 2,048 Hz recommended in practice for fast LED and digital printing applications sit consistently above that. A device with 128 Hz captures only about 1.2 samples in the peak region of a mercury lamp at 120 m/min (400 ft/min), or 1.6 under an LED – the dose can still appear plausible while the peak value becomes practically random. The diagnostic rule is: a large run-to-run scatter of peak values at stable dose is an indicator of an insufficient sampling rate, not of an unstable process. The Nyquist criterion fs ≥ 2 · fmax is the absolute lower limit here; amplitude fidelity requires considerable oversampling.
Where are industrial UV sensors used?
Electronics and semiconductors form the largest end-user segment of UV curing with a 29.43 % revenue share (2025); other studies quote 32 to 35 %. Conformal coating and potting compounds with tight dose windows are critical; lithography uses 248 nm (KrF) and 193 nm (ArF), VUV surface cleaning 172 nm.
Automotive and e-mobility are not separately quantified in market studies; battery cell assembly, power electronics bonding and sensor module encapsulation are named.
Printing and packaging account for 35.25 % of UV curing revenue, with hybrid presses up to 450 m/min and inline LED arrays – the critical quantity here is the sampling rate across the full working width. According to market analysis, automatic readjustment of curing intensity reduces the defect rate by more than 20 %, and process control reporting reduces defects by up to 30 % compared with manual inspection.
Medical technology is considered the fastest-growing end-user segment of UV curing and UV sensing; drivers are catheter and needle bonding as well as UV-C sterilisation.
UV disinfection is the most heavily regulated field: in Germany, drinking water treatment requires a reduction-equivalent fluence of at least 400 J/m² at 254 nm, and UV-C LED devices are currently not approved.
Materials testing and weathering work with defined irradiances at 310 and 340 nm – more on this under UV aging, color fastness and photostability –, and non-destructive testing with sources at (365 ± 5) nm and ambient light ≤ 20 lx. In all cases the critical quantity is the same: the spectrally correctly weighted irradiance at the test location.
How to measure with PWM operation, moving emitters and retrofits in existing lines?
PWM operation: With pulsed LEDs, the integration time decides whether a mean value or a random excerpt is measured. A distinction must be made between the CW value (mean of all samples in a measurement interval), peak max/min, dose (integration of the CW values) and pulse energy (integration at maximum sampling rate over the pulse duration). Practicable rules are an integration time set to an integer multiple of the PWM period and deactivated auto-ranging.
Moving and robot-guided irradiation: Three-dimensional parts can only be exposed homogeneously with a moving emitter; robot-guided drying and arc lamps at 600 mm/s with constant focus distance are industrially established. Design is increasingly simulation-based – analytically via the image source method with wall reflectances and cosine angle of incidence, or via CAD-based optical simulation on imported target geometries. Simulation reduces measurement campaigns, but does not replace them. The dose actually applied on the moving part is captured by a travelling data logger such as the curelog Base.
Retrofit in third-party equipment: Retrofitting requires a trade-off between process proximity and process interference – documented by the loss figures quoted above for 13 versus 38 mm distance. For installation in existing equipment with tight installation space, inline sensors are designed. Cooling, window transmission, contamination management and the reproducibility of the mounting position after maintenance must also be clarified. Where measurement technology, mechanics, safety and data acquisition have to be developed together, the route leads via special machine engineering.
Which quantities must be measured or monitored?
A prioritisation follows from the applications. The primary quantity to monitor is the irradiance at the accessible location closest to the process, from it the dose as a time integral, supplemented by sensor and source temperature. A broadband measurement is sufficient if the source is spectrally stable and the sensor was calibrated for exactly this source. A spectral measurement becomes necessary when source types are mixed, LED wavelengths are changed or sensors are checked against a reference. A spatially resolved measurement across the working width is required as soon as emitter arrays are segmented or parts are three-dimensional.
A realistic uncertainty budget per measuring point includes calibration, spectral mismatch, angular error, linearity, temperature and long-term drift. A published reference example combines 4 % spectral, 3 % angular, 3 % linearity, 5 % calibration, 3 % temperature and 12 % long-term drift into a total uncertainty of 15 % – drift dominates. Instrument specifications of industrial UV measurement technology are 4.5–6.0 % calibration uncertainty (k = 2), below 1 % linearity error and below 3 %/year ageing. How the reliability of such a measurement chain can be demonstrated statistically is described in the measurement system analysis of UV sensors; traceability is provided by an accredited calibration laboratory.
The connection to the controller decides whether a reading becomes controllable and auditable. Analog interfaces (0–10 V, 4–20 mA) deliver the scaled instantaneous value and are sufficient for limit monitoring. Modbus TCP transfers registers over Ethernet and remains a lean, universally available basic interface; however, it knows no semantics, no metadata, no sessions and no security policies. On the sensor side, PLC sensors with analog output signals, the PLC.net with Modbus TCP and JSON over HTTP, and the PLC.D with RS-485, RS-232 and USB cover these connections.
IO-Link fills exactly the gap left by the basic interfaces: it distinguishes four data types – process data with up to 32 bytes per direction, PortQualifier, device data (parameters, identification, diagnostics) and events such as contamination or overheating.
Above the field level, OPC UA provides the information model; OPC UA FX has been released with diagnostics and LLDP modelling. For the vendor-neutral description of the device itself, IEC 63278-1:2023 standardises the Asset Administration Shell; the Digital Nameplate submodel provides nameplate data interoperably.
Beyond the reading itself, the data stream should therefore include: device status according to the four NAMUR NE 107 signals failure, function check, out of specification and maintenance required, calibration status including expiry date, sensor serial number, sampling rate and spectral band. The digital calibration certificate exists as an XML format that is both machine-readable and machine-interpretable in conformity with DIN EN ISO/IEC 17025:2018-03. The practical limitation remains infrastructure: in the DACH region, 58 % of companies use decentralised data processing, but only 16 % at full scale.
To be distinguished from UV inline monitoring of irradiance is absorption and transmission measurement in liquids – that is the domain of process photometers.
The most effective countermeasure is periodic comparison against a reference radiometer such as the RMD Pro. The only normatively complete practice comes from drinking water disinfection: the duty sensor may read at most 5 % above the reference, an adjustment is permissible up to 10 %, a cumulative adjustment sum above 20 % means sensor replacement, at the latest after 10,000 h or two years; control intervals are semi-annual at ≤ 100 m³/h and monthly above. This logic can be transferred to non-regulated processes. For UV measuring devices, a recalibration interval of 12 months from first irradiation is recommended. On the audit side, test equipment management to ISO 9001 additionally requires assessing the impact on already released products when a misreading is detected – which presupposes that time series with sensor ID and calibration history exist.
From sensor signal to measurand: a current output maps the measuring range linearly. The calculator converts between signal and measurand in both directions. All four end points are editable, so that 0–10 V or a restricted range fit alongside 4–20 mA. With 4–20 mA, a signal below the range start means a broken line, not a reading of zero.
The calculator runs in your browser; no data is transmitted.
What do scientific publications show?
Six works provide the technical basis for the central statements of this text on detector ageing, control and sensor classification:
- Ageing of detector materials. Under realistic process load (90 h, 60 mW/cm², 80 °C), a SiC photodiode showed no measurable degradation, while two AlGaN diodes lost about −85 % responsivity in the same test. The sensor's material choice thus decides how long a calibration remains valid. – Weiss, T.; Papathanasiou, K.; Krüger, S.: Aging behavior of AlGaN and SiC UV photodetectors, RadTech.
- Wavelength-resolved detector degradation. UV-optimised Si photodiodes lose less than 5–6 % responsivity in the UV, non-optimised parts fail almost completely at 200 nm; above 300 nm no degradation was detectable in any diode. – Quantification of UV Light-Induced Spectral Response Degradation, PMC10934760.
- Reliability of UV-C LEDs. The evaluation of parts from 14 to 15 production runs yielded a nominal 90–95 % remaining output after 1,000 h, with R70 lifetimes between 1,000 h and more than 10,000 h – evidence that blanket manufacturer lifetime claims do not replace a measurement. – Onushkin et al.: J. Phys. Photonics 7:032002, 2025.
- Controlling the process variable. An FTIR-based real-time control of monomer conversion (2.0 s sampling time, 5.4 ± 0.8 s dead time) fully compensated an imposed 50 % power loss of the UV source – demonstrated at laboratory scale so far. – Hafkamp et al.: Real-time feedback controlled monomer conversion – a new paradigm for UV curing, RadTech.
- Remaining lifetime prediction. Gamma and Wiener processes outperform the industry standard IESNA TM-21; an LSTM-RNN reduced the prediction error by 29.7 %. – Journal of Computational Design and Engineering 12(9):184, 2025.
- Spectral classification of 405 nm. The germicidal effect at 405 nm belongs to visible violet-blue light, not to the UV range – the basis for the metrological distinction between UV and VIS sensor bands. – Maclean et al.: J Hosp Infect, 2014.
The publication finder lists all publications on automation we know of – searchable by device, field and keyword.
Automated UV processes in customer publications
Automated and monitored UV irradiation also appears in several facets in the publications of Opsytec customers – from robot-guided curing to dose capture on pulsed sources.
Describes robot-guided UV curing of three-dimensional parts with constant focus distance – the industrial practice behind the moving irradiation discussed above.
Schnelle und zuverlässige 3D-Lackhärtung
Fraunhofer-Institut für Produktionstechnik und Automatisierung IPA. "Schnelle und zuverlässige 3D-Lackhärtung." JOT Journal für Oberflächentechnik 58.5 (2018): 20-21.
Evaluates an experimental UV-C robot under controlled conditions and in real hospital operation – a moving source with changing geometry whose effect must be demonstrated radiometrically.
Antimicrobial efficacy of an experimental UV-C robot in controlled conditions and in real hospital scenario
Casini, Beatrice, et al. "Antimicrobial efficacy of an experimental UV-C robot in controlled conditions and in real hospital scenario." Journal of Hospital Infection (2024).
Tracks a silicone adhesive under UV exposure in high vacuum with a single multiparameter sensor – process monitoring under conditions where no reference radiometer fits the measurement location any more.
Multiparameter Single Sensor for Space Silicone Adhesive Monitoring Under High-Vacuum Ultraviolet Exposure
Fazzi, Luigi, et al. "Multiparameter Single Sensor for Space Silicone Adhesive Monitoring Under High-Vacuum Ultraviolet Exposure." Journal of Spacecraft and Rockets 60.3 (2023): 740-752.
Documents the decontamination of spice powder with pulsed light via the applied dose – pulsed operation of the kind that cycled UV LED lines also produce.
Pulsed light treatment reduces microorganisms and mycotoxins naturally present in red pepper (Capsicum annuum L.) powder
Woldemariam, Henock Woldemichael, et al. "Pulsed light treatment reduces microorganisms and mycotoxins naturally present in red pepper (Capsicum annuum L.) powder." Journal of Food Process Engineering 45.2 (2022): e13948.
Further works from all application fields are listed under publications by customers by topic.
FAQ on UV measurement in automation
Why is lamp power not sufficient as a process variable?
Between electrical power and effect at the part lie conversion efficiency, source ageing, contamination, window transmission, distance and angle of incidence. UV-C LEDs alone drop to 50–70 % of their initial value within roughly the first 100 operating hours. What must be controlled and documented is therefore the irradiance measured at the point of action, not the equipment state. The general derivation – from electrical power through electro-optical efficiency to the measurand at the point of action – is given under radiometric quantities.
When is a broadband sensor sufficient, and when is a spectral measurement needed?
A broadband sensor is sufficient if the source is spectrally stable and the sensor was calibrated for exactly this source. With source changes, mixed source types or narrowband LEDs, deviations of 9 to 91 % arise depending on the sensor-source combination. Then a spectral measurement or a documented mismatch correction factor is required.
What sampling rate does a fast line require?
The design rule is fs ≳ N · v / L with N ≈ 20 samples in the irradiation zone. With a 25 mm window length and 120 m/min, at least 1,600 Hz result; for fast LED and digital printing applications, 2,048 Hz are recommended. At 128 Hz the peak is captured practically at random at high speeds.
Does H = E · t always hold?
No. The equation presumes a temporally constant irradiance. With PWM operation, ageing sources or moving substrates, the dose must be captured as a true time integral. Moreover, reciprocity is not a natural law of polymerisation: a PWM process achieved a better result with 10 J/cm² than CW operation with 14 J/cm².
Is 405 nm UV radiation?
Normatively no: the CIE upper limit for UV-A is 400 nm, and 405 nm is treated in the literature as visible violet-blue light. Industrially, 405 nm nevertheless counts among the UV curing wavelengths. A reading at 405 nm can only be interpreted with the standard or sensor band stated.
How often must a process UV sensor be adjusted or recalibrated?
For UV measuring devices, 12 months from first irradiation are recommended. In drinking water disinfection, the reference comparison is prescribed semi-annually or monthly, adjustment is permissible up to 10 %, and from 20 % cumulative the sensor must be replaced. This logic is transferable to non-regulated processes.
Which data should a UV sensor deliver besides the reading?
Device status according to NAMUR NE 107 with the signals failure, function check, out of specification and maintenance required, diagnostic events such as contamination or overheating, serial number, calibration status, sampling rate and spectral band. Without these metadata, a reading is not auditable.
Which interface suits which task?
Analog outputs (0–10 V, 4–20 mA) are suitable for limit monitoring, Modbus TCP as a lean Ethernet basic interface for readings. Semantics, identification and diagnostic context cannot be transported that way; for those, IO-Link with IODD, OPC UA information models or AAS submodels are needed.
How can UV radiation be monitored in a production system?
With a permanently installed sensor at the accessible point closest to the process, whose value the controller reads. What is monitored is the irradiance; the dose follows from it as a time integral. Analogue sensors with 0–10 V or 4–20 mA are sufficient for limit monitoring, while digital sensors over RS-485 or Modbus TCP also supply calibration status and device condition. Operating hours or lamp current are no substitute for a measurement.
Which UV sensors are suitable for Industry 4.0?
What matters is not the sensor alone but what it transmits alongside the reading. An analogue output delivers a number without context. Networked manufacturing requires sensors with a digital interface that carry serial number, calibration status, spectral band and device status to NAMUR NE 107. Modbus TCP over Ethernet is the lean basis; semantics and identification are only carried by IO-Link with IODD, OPC UA information models or AAS submodels.
How does UV process control work?
The sensor measures the irradiance at the point of action, the controller compares it with the setpoint and adjusts lamp power, dimming value or feed rate. Two limits apply: the process window has to be specified in two dimensions, with lower and upper limits for irradiance and dose, and with pulsed LEDs the integration time must be an integer multiple of the PWM period. Without these definitions the system controls on a random section. Control speed is limited by the measuring chain: digital sensors typically deliver new values in 20 ms.
Related application fields
The path from a reading to a process release looks the same in several fields: in packaging and filling technology the UV step has to produce a release decision within the cycle time, in the automotive industry the dose is an integral along a robot-guided path, and in light and display measurement photometric testing moves from laboratory sampling to the end of the line. The same process chain reappears in UV bonding, potting and encapsulation, in transmission testing for laser processes and in fluorescent inspection. How the same task presents itself with a moving emitter – where the dose arises as an integral along a path rather than as the product of irradiance and time – is covered under robotics. The full picture is in the UV applications overview.
Author: Dr. Mark Paravia
Dr.-Ing. Mark Paravia is the managing director of Opsytec Dr. Gröbel GmbH in Ettlingen and heads the accredited calibration laboratory. Following his research on pulsed xenon excimer discharges at the Institute of Lighting Technology at KIT, his current focus is on optical radiation measurement technology. He is vice-chair of the DIN Standards Committee FNL 7 “Optical Radiation,” and a member of the DVGW Project Group on UV Disinfection.
Consulting on UV process integration
Unsure whether the reading of an existing system describes the irradiance in the actual bondline – or merely the state of a sensor whose spectral band does not match the LED wavelength in use? Clarification starts with three pieces of information: sensor band, sampling rate and the date of the last traceable calibration. On this basis we assess with you whether your process window is being monitored or merely an operating state is being displayed – send us your question.