

Solar Simulators in Photovoltaics: Fundamentals and Measurement Technology
A solar cell is not a universal light meter but a spectrally selective converter: it does not answer how much radiation hits it, but which radiation. A solar simulator therefore has to produce more than a total irradiance of 1000 W/m² - it must reproduce a spectral distribution close enough to the standardised reference spectrum AM1.5G. The central challenge is that deviations occur along three independent dimensions - spectral match, spatial uniformity and temporal stability - which do not compensate one another. Only the standardised classification of these three quantities under IEC 60904-9 makes efficiency measurements on solar cells and modules comparable across laboratories, manufacturers and certification bodies.

How is the photovoltaic test-equipment market developing?
Photovoltaics became the world's largest installed electricity-generation technology for the first time in 2025: global additions passed 600 gigawatts for the first time, cumulative capacity reached roughly 2,800 gigawatts, and solar power accounted for more than three-quarters of the world's new renewable generating capacity, according to the International Energy Agency's Global Energy Review 2026 (IEA, 2026). For test and measurement technology, the relevant story is not the volume but the technological diversification behind it: alongside crystalline silicon, heterojunction cells, thin-film systems based on CdTe and CIGS, and perovskite-silicon tandem cells are becoming established, together with a growing share of bifacial modules.
A solid, narrowly defined market figure for solar simulators alone cannot currently be stated with confidence: commercial market studies on "solar simulators" diverge by more than an order of magnitude, because they lump together different device categories, sales channels and world regions. A better-defined adjacent indicator is the market for photovoltaic test equipment as a whole: this was estimated at roughly USD 0.96 billion in 2025 and is projected to grow to about USD 1.61 billion by 2031, corresponding to an annual growth rate of 8.75 percent; automated test systems are growing faster still, at around 10.2 percent per year (Mordor Intelligence, 2026). According to the same report, solar simulators remain concentrated on two application fields: in-house quality control in cell and module manufacturing, and the metrologically more demanding use in research and calibration laboratories.
The technical consequence of this market development follows a clear chain: growing module diversity and higher cell efficiencies increase the sensitivity of test results to spectral deviations of the test source. Every additional material class - thin-film, bifacial, tandem - brings its own spectral responsivity curve, which effectively narrows the error margin a solar simulator can afford compared with the simpler monocrystalline silicon cells of the 1980s, for which the original standards were designed.
How does a solar simulator work?
A solar simulator produces artificial light that reproduces the spectral irradiance of natural sunlight under defined atmospheric conditions. The reference quantity is the AM1.5G spectrum (Air Mass 1.5, Global), a spectrum derived computationally from an atmospheric model that represents mid-European to North American latitudes at a solar zenith angle of 48.2° and is normalised to an integrated irradiance of 1000.4 W/m² (ASTM G173-03). A light source - usually a gas-discharge lamp or a combination of many LEDs - is shaped through optics, filters and control electronics so that intensity, spectrum and uniformity in the sample plane come as close as possible to this reference spectrum.
Physically, what matters is that a solar cell does not integrate irradiance itself, but the product of spectral irradiance and the cell's wavelength-dependent spectral responsivity. Two light sources with identical total irradiance but different spectra produce different photocurrents on the same cell. A solar simulator is therefore not calibrated at the lamp output but in the plane of the sample, using a traceably calibrated reference solar cell or a spectroradiometer.
What technologies are used?
Gas-discharge lamps historically dominated because, when the first relevant standard ASTM E927 (1979) was drafted, they were the only available sources with a sufficiently sun-like broadband spectrum (ASTM E927-19). For roughly two decades, LED-based systems have increasingly established themselves and are now displacing traditional xenon technology in production lines and laboratories.
| Technology | Characteristics | Advantages | Limitations | Typical application |
|---|---|---|---|---|
| Xenon arc lamp (continuous or pulsed) | Ionised high-pressure xenon gas, broadband spectrum with sharp atomic emission lines in the near infrared | High intensity, good native spectral match, collimable high-intensity beam | Emission lines must be filtered out, high maintenance effort, limited lamp lifetime, spectral drift over operating life | Module production (flash testers), certification laboratories |
| Metal-halide high-pressure discharge lamp | Arc through vaporised mercury and metal halides | Comparatively low-cost for large test areas | High energy consumption, short lifetime, lower classification grade | Older large-area module testers |
| Single- or multi-channel LED | Narrowband emission (10-20 % bandwidth relative to peak wavelength), many channels combined | Long lifetime, spectrum adjustable electrically rather than optically, no filters needed, high temporal stability, switching times below 1 ms | Junction temperature affects emission; formal class compliance is achievable without continuous spectral coverage (see the section on misconceptions) | Laboratory simulators, inline testing in cell manufacturing |
| Multi-source LED simulator (spectrally tunable) | Dozens to several thousand independently controllable LED channels | Freely adjustable spectrum for tandem and multi-junction cells, simulation of different times of day and locations | High control and calibration effort, high investment cost | Perovskite-silicon tandem cells, multi-junction cells, research |
| Quartz-tungsten-halogen (QTH) | Incandescent lamp with halogen additive, colour temperature up to 3400 K | High intensity, low cost | Little UV, much more IR than sunlight | Concentrator photovoltaics with lower spectral sensitivity |
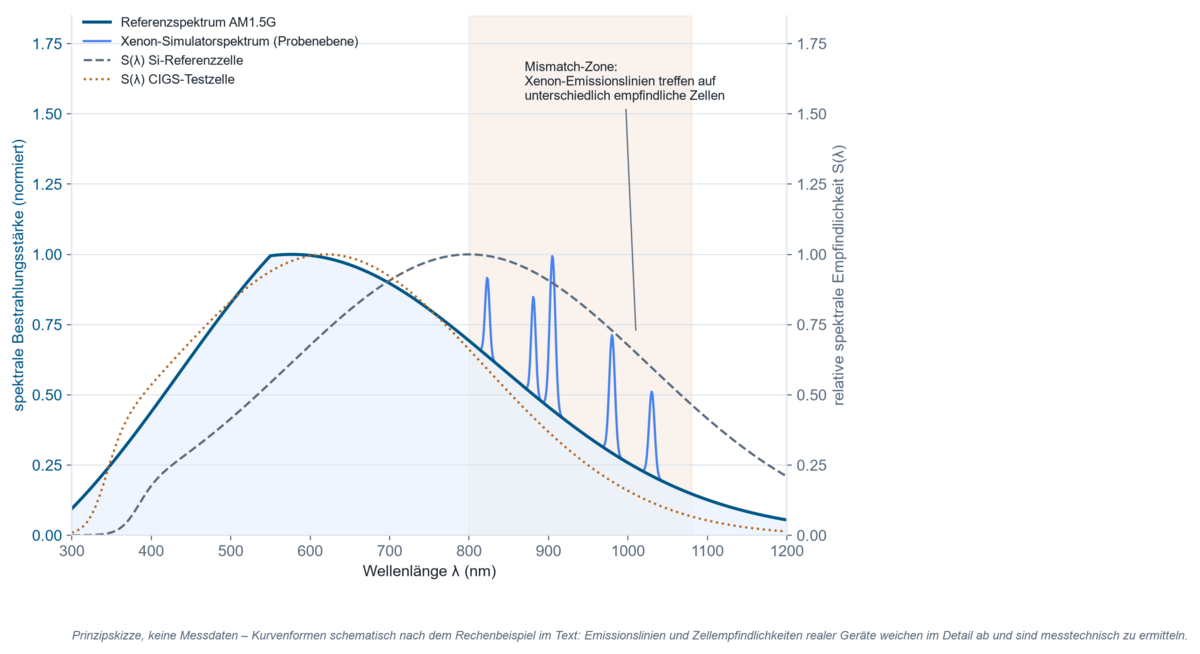
Because of their native broadband characteristics, xenon lamps remain widespread in large-area module production, but they require regular re-adjustment through spectral filtering, since their emission lines, particularly above 800 nm, worsen the classification (IEC 60904-9:2020). In comparative measurements of PV modules' current-voltage curves, LED systems have shown performance at least equivalent to, and in stability and spectral flexibility sometimes superior to, xenon sources (Chojniak et al., 2024).
Which process parameters matter?
A solar simulator is not judged by a single figure but by several, mutually independent physical quantities:
- Spectral match describes how well the simulator's irradiance in defined wavelength intervals agrees with the AM1.5G reference spectrum. It is decisive because a cell's measured photocurrent depends on the overlap integral of source spectrum and cell responsivity - not on the source's total power.
- Spatial non-uniformity quantifies the variation of irradiance across the test area. It mainly affects large modules and series-connected cell strings, since the weakest-illuminated sub-area can limit the total current.
- Temporal instability captures variations in irradiance during the measurement. For pulsed simulators it is particularly critical, because lamp spectrum and intensity keep changing during the rise and decay of the flash tube.
- Total irradiance must be set to the reference value of 1000 W/m², since a solar cell's characteristic curve depends non-linearly on irradiance; a deviation does not affect all curve parameters proportionally.
- Cell temperature is fixed as the third coordinate of Standard Test Conditions (STC), alongside spectrum and intensity (25 °C). The efficiency of crystalline silicon cells typically drops by 0.3 to 0.5 percentage points per kelvin of temperature rise, so inadequate temperature control distorts measurement results without this being visible in the spectrum.
- Spectral responsivity of the reference and test cell together with the source spectrum determines the spectral mismatch factor (see the expert section). It is not a fixed property of a cell type but depends on layer structure, encapsulation and ageing state.
What limits the process, or causes errors?
The most common misconception in practice is equating electrical lamp power with optical irradiance. The two quantities are not linearly coupled: a lamp's electro-optical efficiency changes with operating time, ageing, filter condition and temperature, so a nominally constant electrical power can produce a drifting optical irradiance. Likewise, an exposure time on its own is not meaningful unless it is clear which irradiance it refers to - an "exposure duration" without an accompanying dose or intensity figure is technically incomplete.
A second common error is measuring outside the actual sample plane. A reading at the lamp exit or at a fixed reference sensor outside the test field describes the source, not the actual irradiation of the device under test; differences in optical path length, stray light and vignetting can cause deviations of several percent that are not visible at the sensor.
Third, the apparent formal fulfilment of a classification is often overrated. The IEC 60904-9 classification rates irradiance in six to twelve broad spectral bins; within a bin it is not specified where in that interval the required intensity actually lies. An LED simulator can therefore formally reach class A or A+ even though its spectrum consists of narrow peaks separated by spectral gaps. Comparative evaluations show real commercial systems with spectral coverage of only 65 to 79 percent while simultaneously achieving a high formal class rating (IEC 60904-9:2020). For cells with a broad, continuous spectral responsivity - thin-film or multi-junction cells, for example - such a gap is technically more relevant than for a narrowly sensitive reference cell.
Fourth, the reference-cell method, in which simulator intensity is matched to a reference cell's calibrated short-circuit current, is valid only under restrictive conditions: it only transfers correctly to the test cell if either reference and test cell have identical spectral responsivity, or the simulator spectrum exactly matches the reference spectrum. Neither is ever fully satisfied in practice; the resulting systematic error is called spectral mismatch and must be corrected by calculation, not calibrated away (ASTM E948).
Fifth, many characteristic values are only valid under the assumption that the device under test and its environment are in thermal and electrical equilibrium. For pulsed xenon simulators with flash durations in the millisecond range, time often does not suffice for capacitive effects in large-area modules, or the transient, light-induced behaviour of unstable materials such as perovskite, to settle fully - the measured curve then describes a transient state, not a steady operating point.
Spectral responsivity of different cell technologies
A solar cell's spectral responsivity is not a universal quantity; it is determined by the band gap, layer thickness and optical losses of the respective absorber material. Crystalline silicon absorbs roughly between 400 and 1100 nanometres; the original spectral intervals of ASTM E927 and the early IEC 60904-9 editions were defined exactly for this range. Thin-film technologies such as CdTe and CIGS have their absorption edge still within this window, but benefit from the evaluation range extended to 300-1200 nanometres in 2020, since their short-wavelength responsivity is captured better there (IEC 60904-9:2020).
Even the extended range is not enough for perovskite-silicon tandem cells and III-V multi-junction cells: III-V multi-junction cells have absorption bandwidths of up to 1800 nanometres. Tandem cells add a structural peculiarity: the subcells are connected in series, so the subcell with the lowest photocurrent limits the total cell current (current-matching condition). A spectral deviation of the test source does not act here as a uniform error across the whole curve, but shifts which subcell becomes limiting - the result is a characteristic curve corresponding to an irradiation situation that does not occur under natural sunlight. For this reason, characterising tandem cells requires a spectral adjustment of the simulator spectrum in which each subcell is tuned specifically to the photocurrent it would generate under reference conditions (Chojniak et al., 2024).
Expert section: the spectral mismatch factor
The spectral mismatch factor M corrects the systematic error that arises when the simulator spectrum, the reference spectrum and the spectral responsivities of the reference and test cell diverge from one another. It is normatively defined in ASTM E948 and IEC 60904-7:
M = [ ∫ Eref(λ)·Sref(λ) dλ / ∫ Esim(λ)·Sref(λ) dλ ] × [ ∫ Esim(λ)·St(λ) dλ / ∫ Eref(λ)·St(λ) dλ ]
Here Eref(λ) is the spectral reference spectrum (usually AM1.5G), Esim(λ) is the solar simulator's actual spectrum in the sample plane, Sref(λ) is the reference cell's relative spectral responsivity, and St(λ) is the test cell's relative spectral responsivity. Because only relative spectral shapes enter the equation, absolute calibration factors cancel out; only the curve shape matters. The test cell's M-corrected short-circuit current under Standard Test Conditions is obtained by dividing the current measured under the simulator by M (ASTM E948).
Applicability requires that both the simulator spectrum and both cell responsivities are known with sufficient spectral resolution over the relevant wavelength range; measurement uncertainties in spectral responsivity feed directly into the uncertainty of M. Limits of the model: for two cells with strongly different, particularly structured spectral responsivity - a thin-film cell against a crystalline reference cell, for example - M can deviate noticeably from 1 and is simultaneously more sensitive to small spectral changes in the source. A systematic uncertainty analysis has shown that the mismatch factor's combined uncertainty can be derived from the uncertainties of the input spectra using Monte Carlo simulation, and depends strongly on how strongly correlated the individual uncertainty contributions are spectrally: the expanded uncertainty of M ranged, depending on the assumed degree of correlation, between 0.06 and 1.26 percent (Maham, Kärhä & Ikonen, 2023). The practical consequence: M is not a fixed instrument constant but must be determined anew for every combination of simulator, reference cell and test cell, and its uncertainty must be stated in the calibration result.
Worked example: order of magnitude of spectral mismatch for a thin-film cell
Assumptions. A crystalline silicon reference cell with known spectral responsivity is used to set the intensity of a class-A xenon solar simulator. A CIGS thin-film cell is to be tested; its spectral responsivity is higher than silicon's in the short-wavelength range (400-600 nm) and lower above 900 nm - a pattern typical of thin-film technologies and repeatedly documented in the literature.
Model. M is formed from the four spectral integrals according to the definition above.
Calculation (qualitative, based on published orders of magnitude). If the xenon spectrum deviates from the AM1.5G reference spectrum by several percent above 800 nm because of native emission lines, this affects the CIGS test cell more strongly than the silicon reference cell, since their relative weighting differs in this spectral region. Systematic uncertainty studies of reference-cell calibrations have documented correction factors of a few percent, with spectrally sensitive uncertainty contributions ranging from under one to a few percent, for spectrally dissimilar cell pairs (Hohl-Ebinger & Warta, 2011).
Interpretation. An uncorrected efficiency value can therefore appear plausible while being systematically too high or too low, without this being visible in the shape of the curve. For reliable efficiency figures, combining spectrally resolved simulator measurement with known cell responsivity is therefore not an optional extra measurement but part of the actual curve measurement.
Classification under IEC 60904-9
The internationally harmonised classification of solar simulators under IEC 60904-9 (adopted in Germany as DIN EN IEC 60904-9 VDE 0126-4-9) rates three characteristic values independently of one another, named in the order spectral match - spatial non-uniformity - temporal instability, for example as "class AAA" or "class A+A+A+":
| Class | Spectral match per interval | Spatial non-uniformity | Temporal instability | Evaluation range |
|---|---|---|---|---|
| A+ | 87.5-112.5 % | 1 % | 0.25 % | 300-1200 nm |
| A | 75-125 % | 2 % | 0.5 % | 400-1100 nm |
| B | 60-140 % | 5 % | 2 % | 400-1100 nm |
| C | 40-200 % | 10 % | 10 % | 400-1100 nm |
Source: IEC 60904-9:2020.
The 2020 edition additionally introduced two optional metrics, not yet used for classification: spectral coverage (SPC) and spectral deviation (SPD). SPC states the share of the spectrum between 300 and 1200 nm in which the simulator's irradiance reaches at least 10 percent of the AM1.5G reference value; SPD sums the absolute spectral errors over the entire interval. Both metrics were introduced because pure bin classification - as described in the previous section - does not reliably distinguish LED simulators with a gapped but "conveniently placed" spectrum from those that actually reproduce the spectrum continuously.
Where is solar simulation used?
Cell and module manufacturing. In industrial production, flash testers sort modules into power classes based on their performance measured under simulated irradiation. The critical process parameter here is above all temporal stability during the short flash duration, since throughput and reproducibility depend directly on the repeatability of the flash.
Research and development. University and institutional laboratories - for example when developing new absorber materials - need spectrally flexible simulators that often run continuously, because new cell concepts such as perovskite-silicon tandems must be characterised under defined steady-state light to capture metastable effects. The critical process parameter is spectral tunability to the respective subcell.
Accredited calibration and certification laboratories. Manufacturer-independent efficiency verification requires traceable reference cells and a documented, spectrally resolved characterisation of the simulator source. The critical process parameter is the measurement uncertainty of the spectral mismatch factor, which must be stated in the calibration certificate.
Space photovoltaics. For satellite and spacecraft cells, the reference is not AM1.5G but the extraterrestrial AM0 spectrum, with an irradiance of roughly 1367 W/m² and a short-wavelength component stronger than AM1.5G's, since the Earth's atmosphere no longer filters the spectrum. The critical process parameter here is spectral match in the UV and blue range.
Concentrator photovoltaics (CPV). Systems that optically concentrate sunlight require simulators with high irradiance, from several hundred to several thousand "suns". The critical process parameter is the uniformity of the strongly focused light spot, since inhomogeneities at high concentration translate disproportionately into local thermal and electrical effects.
Material ageing and encapsulation. Adjacent to electrical performance testing is the accelerated ageing testing of encapsulant films, adhesives, back-sheet materials and anti-reflective coatings under UV irradiation. Here, it is not electrical yield but photochemical effect that matters - see the deeper background on UV ageing, colour fastness and photostability for more.
What solutions exist for special process conditions?
Tandem and multi-junction solar cells require multi-source simulators with typically several dozen independently controllable spectral channels. A system built at the Fraunhofer Institute for Solar Energy Systems ISE for perovskite-silicon tandem modules combines 28 spectrally adjustable light channels across 40 light sources with a total of 18,400 LEDs spanning a wavelength range from 320 to 1650 nanometres, and additionally allows different times of day and location spectra to be simulated (Fraunhofer ISE, 2023).
Bifacial modules require controlled irradiation of both the front and the rear side, since the additional rear-side yield in the field depends on diffuse and reflected radiation. The technical specification IEC TS 60904-1-2 describes procedures for measuring the characteristic curves of bifacial cells and modules under both natural and simulated irradiation.
Unstable materials (perovskite). Classic flash simulators from silicon manufacturing cannot readily be used for perovskite-based cells, because the short flash duration is not enough to capture this material class's light-induced, metastable behaviour. Characterisation under continuous illumination with stabilised power measurement over a defined period is required - a procedure agreed by an international research consortium recommends, among other things, light intensities of 800 to 1000 W/m² with documented spectral characteristics of the source (Khenkin et al., 2020).
Concentrated irradiation. For CPV systems, continuous xenon simulators with a homogenising rod and collimation optics, or pulsed high-flux setups that briefly produce several hundred suns without thermally overloading the device under test, are used.
Which quantities need to be measured or monitored?
The starting point for any solar-simulator characterisation is the question of which measurement quantity is actually meaningful for the given application - not which instrument happens to be available. For pure intensity monitoring in day-to-day production, a broadband radiometric measurement with a calibrated silicon or thermopile sensor in the sample plane is often sufficient, provided the source spectrum is known and stable. As soon as a solar simulator is newly commissioned, requalified after a lamp change, or used for certification, a spectrally resolving measurement becomes necessary, because only that enables classification under IEC 60904-9 and determination of the spectral mismatch factor.
Spatial measurements become necessary once the test area is large relative to the source's uniformity zone - for whole modules rather than individual cells, for example; the standard requires a raster measurement at a minimum number of defined positions. Time-resolved measurements are indispensable for pulsed sources or sources dependent on a thermal run-up, since intensity, and sometimes spectrum, can change during the measurement window.
For each of these measurements, measurement uncertainty must be considered explicitly: it comprises the sensor's calibration uncertainty, the sensor's own spectral mismatch relative to the reference spectrum, and - for derived efficiency values - the uncertainty of the mismatch factor. Traceability of the instrumentation used to national or international standards is not a formality but a precondition for different laboratories to report comparable values at all.
How is the process monitored in modern automated lines?
In automated production lines, the solar simulator is usually part of an inline flash tester that tests every module with a short light pulse after lamination and automatically sorts it into power classes based on the measured curve. What matters technically is less the pure network connectivity than the need to monitor the source's spectral and intensity-related stability over thousands of test cycles: lamp ageing, contamination of optical elements and thermal drift gradually change the effective irradiance without this being visible from the equipment's outward appearance.
Production-oriented monitoring concepts therefore combine a complete spectral reference measurement at longer intervals with a continuous, broadband control measurement at a fixed wavelength range between full calibration cycles. This allows a gradual spectral shift to be detected early, without having to run a complete, time-consuming spectral measurement at every single test cycle. Integrating such control measurements into the plant control system makes it possible to automatically detect deviations from a stored reference spectrum before they show up in incorrectly classified modules.
What developments are shaping the market?
- Transition from gas-discharge lamps to LED technology. LED simulators are increasingly replacing xenon and metal-halide systems because they offer longer lifetimes, lower maintenance and spectral shaping that is adjustable electrically rather than optically. The technical consequence is a shift in testing focus from filter optics toward electronic channel control and software-based spectral calibration of individual LED groups.
- Introduction of the A+ class and optional spectral metrics. IEC 60904-9:2020 doubled the evaluation stringency and introduced SPC/SPD, an instrument that specifically counters the formal fulfilability of bin classification by gapped LED spectra. The technical consequence is rising documentation effort for equipment manufacturers, who will increasingly need to state not just a class designation but also coverage and deviation values transparently.
- Multi-source systems for tandem technologies. With the market entry of perovskite-silicon tandem modules, simulators with several dozen independently controllable spectral channels and extended wavelength ranges beyond 1600 nanometres are emerging. The technical consequence is a closer coupling between simulator calibration and cell characterisation, since the spectral setting must be determined individually for each subcell.
- Bifacial test procedures. The technical specification IEC TS 60904-1-2 formalises procedures for measuring bifacial modules under simulated and natural irradiation. The technical consequence is additional sensor demand for rear-side irradiation and a growing need for test stands that can controllably illuminate both module sides simultaneously.
- Stabilised power protocols for unstable materials. For perovskite and other metastable cell technologies, consensus test protocols with continuous illumination and time-resolved power stabilisation are becoming established. The technical consequence is a shift away from the pure snapshot of classic flash measurement toward a power curve documented over minutes to hours.
What does the scientific literature show?
The following publication develops a method for precisely adjusting the spectrum of LED-based multi-source simulators specifically for tandem solar cells, and is therefore directly relevant to the measurement technology of perovskite-silicon modules:
"A precise method for the spectral adjustment of LED and multi-light source solar simulators", Chojniak, D., Schachtner, M., Reichmuth, S. K., Bett, A. J., Rauer, M., Hohl-Ebinger, J., Schmid, A., Siefer, G., Glunz, S. W., Progress in Photovoltaics: Research and Applications, 32(6), 372-389, 2024, DOI: 10.1002/pip.3776.
This work systematically investigates how the uncertainty of the spectral mismatch factor can be computed from the uncertainties of the spectra involved using Monte Carlo methods, providing a quantitative basis for calibration-uncertainty budgets:
"Spectral Mismatch Uncertainty Estimation in Solar Cell Calibration Using Monte Carlo Simulation", Maham, K., Kärhä, P., Ikonen, E., IEEE Journal of Photovoltaics, 13(6), 899-904, 2023, DOI: 10.1109/JPHOTOV.2023.3311890.
The following, frequently cited foundational work was the first systematic treatment of the spectral mismatch factor's uncertainty under Standard Test Conditions and remains a methodological reference for calibration laboratories today:
"Uncertainty of the spectral mismatch correction factor in STC measurements on photovoltaic devices", Hohl-Ebinger, J., Warta, W., Progress in Photovoltaics: Research and Applications, 19(5), 573-579, 2011, DOI: 10.1002/pip.1059.
This internationally agreed position paper defines measurement and reporting protocols for stability testing of perovskite solar cells and underpins, among other things, the need for continuous, spectrally documented illumination instead of short flash measurements:
"Consensus statement for stability assessment and reporting for perovskite photovoltaics based on ISOS procedures", Khenkin, M. V., Katz, E. A., Abate, A. et al., Nature Energy, 5(1), 35-49, 2020, DOI: 10.1038/s41560-019-0529-5.
What do customer publications show?
Photovoltaics also shows up in several facets in our own customer publications - from UV ageing of module encapsulation, through UV processing of cell layers, to testing solar arrays for spaceflight use.
Compares four encapsulant materials for photovoltaic modules under UV irradiation in the Atacama Desert - one of the world's most UV-intensive test fields for module ageing.
Comparing the effects of ultraviolet radiation on four different encapsulants for photovoltaic applications in the Atacama Desert
Correa-Puerta, Jonathan, et al. "Comparing the effects of ultraviolet radiation on four different encapsulants for photovoltaic applications in the Atacama Desert." Solar Energy 228 (2021): 625-635.
Investigates how UV-induced degradation develops at the passivated contacts of silicon heterojunction cells - one of the cell technologies this page names explicitly as a spectrally distinct class.
Passivating Contacts-Related Ultraviolet-Induced Degradation in Silicon Heterojunction Solar Cells
Xu, Binbin, et al. "Passivating Contacts-Related Ultraviolet-Induced Degradation in Silicon Heterojunction Solar Cells." Small Structures 7.6 (2026).
Uses UV-LED irradiation deliberately for layer-selective annealing of perovskite solar cells and determines the crystallisation energy needed - an example of UV as a manufacturing tool, not only as a test method.
Rapid Layer-Specific Annealing Enabled by Ultraviolet LED with Estimation of Crystallization Energy for High-Performance Perovskite Solar Cells
Ouyang, Zhongliang, et al. "Rapid Layer-Specific Annealing Enabled by Ultraviolet LED with Estimation of Crystallization Energy for High-Performance Perovskite Solar Cells." Advanced Energy Materials 10.4 (2020): 1902898.
Develops a dedicated high-irradiance setup for precisely controlled, accelerated photodegradation of organic solar cells - methodologically related to the high-flux solar simulators for concentrator photovoltaics described on this page.
Development of a High Irradiance Setup for Precisely Controlled Accelerated Photo-Degradation of Organic Solar Cells
Burlafinger, Klaus. Development of a High Irradiance Setup for Precisely Controlled Accelerated Photo-Degradation of Organic Solar Cells. Diss. Friedrich-Alexander-Universität Erlangen-Nürnberg (FAU), 2020.
Tests solar-array materials from the ESA BepiColombo mission under high intensity and high temperature - a practical example of space photovoltaics as described in this page's section on application fields.
High-intensity high-temperature testing of materials for the Bepi Colombo MPO and MTM solar arrays
Tighe, Adrian, et al. "High-intensity high-temperature testing of materials for the Bepi Colombo MPO and MTM solar arrays." CEAS Space Journal 13 (2021): 475-492.
Further work from related topic areas is compiled in the publications by customers, sorted by topic.
Background and further sources
- IEC 60904-9:2020, Photovoltaic devices - Part 9: Solar simulator performance requirements (national: DIN EN IEC 60904-9 VDE 0126-4-9); in addition IEC TS 60904-1-2:2024 (bifacial modules) and ASTM E927-19 / ASTM G173-03.
- International Energy Agency (IEA): Global Energy Review 2026 - Technology: Solar PV and wind, 2026. https://www.iea.org/reports/global-energy-review-2026/technology-solar-pv-and-wind
- Khenkin, M. V.; Katz, E. A.; Abate, A. et al.: Consensus statement for stability assessment and reporting for perovskite photovoltaics based on ISOS procedures, Nature Energy 5(1), 35-49, 2020. https://doi.org/10.1038/s41560-019-0529-5
- Chojniak, D.; Schachtner, M.; Reichmuth, S. K. et al.: A precise method for the spectral adjustment of LED and multi-light source solar simulators, Progress in Photovoltaics 32(6), 372-389, 2024. https://doi.org/10.1002/pip.3776
- Hohl-Ebinger, J.; Warta, W.: Uncertainty of the spectral mismatch correction factor in STC measurements on photovoltaic devices, Progress in Photovoltaics 19(5), 573-579, 2011. https://doi.org/10.1002/pip.1059
- Maham, K.; Kärhä, P.; Ikonen, E.: Spectral Mismatch Uncertainty Estimation in Solar Cell Calibration Using Monte Carlo Simulation, IEEE Journal of Photovoltaics 13(6), 899-904, 2023. https://doi.org/10.1109/JPHOTOV.2023.3311890
FAQ on solar simulators in photovoltaics
How does a solar simulator work in photovoltaics?
A solar simulator reproduces the spectral irradiance of sunlight under defined reference conditions (usually AM1.5G, 1000 W/m², 25 °C cell temperature). A light source is adjusted through optics, filters or - in LED systems - electronic channel control so that the spectrum, spatial distribution and time behaviour of the irradiance stay within the limits set by the standard.
Which wavelength range or spectrum is suitable for photovoltaic testing?
AM1.5G is the standard for terrestrial applications, AM0 for spaceflight applications. The relevant wavelength range depends on the cell type: 400-1100 nm for classic silicon, 300-1200 nm for thin-film and modern silicon cells, up to 1800 nm for III-V multi-junction cells.
What irradiance is required for Standard Test Conditions?
Standard Test Conditions (STC) specify 1000 W/m² AM1.5G irradiance at 25 °C cell temperature. These three quantities - spectrum, intensity, temperature - must all be met together; missing any one of the three makes a measurement result incomparable with other measurements.
What is the difference between class AAA and class A+A+A+?
Both denote the highest, or an extended, classification under IEC 60904-9. Class AAA meets class A in all three criteria (spectrum, uniformity, stability). Class A+ was introduced in 2020, requires tolerances twice as tight as class A, and must be demonstrated over an extended spectral range of 300-1200 nm.
Why does a solar simulator produce incorrect measurement values despite nominally sufficient lamp power?
Electrical lamp power and optical irradiance in the sample plane are not linearly coupled; ageing, filter condition and temperature change the electro-optical efficiency. In addition, a spectral mismatch error can occur when the source spectrum and cell responsivity deviate from the reference case - this error is independent of intensity and must be corrected by calculation.
How is a solar simulator's spectral irradiance measured?
Spectral characterisation is performed with a calibrated spectroradiometer in the sample plane, complemented by a raster measurement across the test area to determine spatial uniformity and, for pulsed sources, a time-resolved measurement during the flash duration.
Which simulator technology is suitable for tandem solar cells?
Perovskite-silicon tandem and multi-junction solar cells require multi-source LED simulators with independently controllable spectral channels, because each subcell must be tuned individually to its reference photocurrent. Classic single- or dual-lamp xenon systems generally cannot meet this requirement.
Why isn't a snapshot from a flash tester enough for perovskite cells?
Perovskite materials show metastable, light-induced behaviour that only stabilises after several seconds to minutes of continuous illumination. A millisecond-range flash only captures a transient state; agreed test protocols therefore call for a time-resolved power measurement under steady-state light.
Author: Dr. Mark Paravia
Dr.-Ing. Mark Paravia is the managing director of Opsytec Dr. Gröbel GmbH in Ettlingen and heads the accredited calibration laboratory. Following his research on pulsed xenon excimer discharges at the Institute of Lighting Technology at KIT, his current focus is on optical radiation measurement technology. He is a recognized UV expert, vice-chair of the DIN Standards Committee FNL 7 “Optical Radiation,” and a member of the DVGW Project Group on UV Disinfection.
Not sure what spectrum is actually reaching the sample plane?
A nominal class designation says little about how stable and spectrally uniform a solar simulator actually is during ongoing operation. Anyone who needs reliable efficiency figures for cells, modules or new material classes cannot avoid a spectrally resolved characterisation in the sample plane - and traceable calibration of the instrumentation used for it. For the spectral characterisation of solar simulators and global irradiance, the SR900 is available; for continuous monitoring of a fixed wavelength range between full calibration cycles, an RMD Pro; and for controlled UV exposure testing of encapsulant materials, irradiation chambers with dose-controlled operation via UV-MAT. Contact us about your test requirement.
