Skip to main content Skip to page footer
professional
photonics.

Markets & applications for UV radiation and optical measurement

In research and production, optical radiation is three things at once: a tool, a process variable and a test variable. It drives chemical reactions, inactivates micro-organisms, cross-links polymers, ages materials under controlled conditions and stimulates biological systems. In nearly every case the engineering question is the same: which spectral radiation actually reaches the sample, how evenly is it distributed, and for how long?
The application fields at a glance

The fields are ordered by the job the radiation does in them, not by product group. Where a piece of work belongs in more than one field, it is linked from both.

Environment & energy
Here radiation drives a chemical conversion.

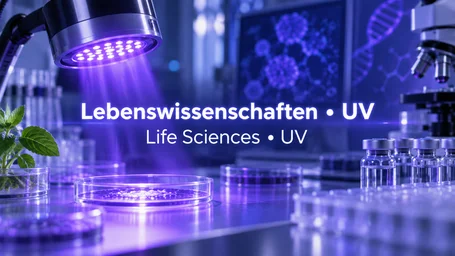
Life sciences
Here radiation meets living systems, whether intended or damaging.

Industry & manufacturing
Here radiation is a production step with a cycle time and a release criterion.

Testing & qualification
Here radiation is the test variable, not the tool.

Further fields – among them automation, electronics and semiconductors, bonding and potting, fluorescent inspection, packaging, optics, lighting technology, metrology and occupational safety – will follow in the next stages.

Subject Matter Expert

Author: Dr. Mark Paravia

Dr.-Ing. Mark Paravia is the managing director of Opsytec Dr. Gröbel GmbH in Ettlingen and heads the accredited calibration laboratory. Following his research on pulsed xenon excimer discharges at the Institute of Lighting Technology at KIT, his current focus is on optical radiation measurement technology. He is a recognized UV expert, vice-chair of the DIN Standards Committee FNL 7 “Optical Radiation,” and a member of the DVGW Project Group on UV Disinfection.

Why lamp power does not describe the load on the sample

The electrical input of a lamp or LED says nothing about how much of that power leaves the source as usable radiation in the relevant waveband – let alone how much of it arrives at the sample. Two sources rated identically in watts can produce entirely different results. The same applies to settings given as a percentage of device output: that describes a dial position, not a physical quantity.

What can be relied on is the radiant power arriving in a defined spectral band at a defined position. Between source and sample sit geometry, working distance, reflection, filters, windows and – with liquids – absorption in the medium. Each of these changes the outcome while the lamp setting stays untouched. Ageing adds to this: output falls over operating hours, and with discharge lamps the spectrum shifts as well. See ageing of UV lamps and UV LEDs for what that looks like in practice.

Broadband radiometer or spectroradiometer?

A broadband radiometer integrates over a fixed spectral band and returns a single figure. That is sufficient as long as the source is known and unchanged and the point is to monitor repeatability – the common case in running production. The condition is that the spectral response of the sensor suits the emission of the source; where it does not, a systematic error remains that no calibration can remove. The background is set out under spectral mismatch of UV sensors.

A spectroradiometer instead resolves the distribution across wavelength. That becomes necessary as soon as different source technologies are compared, the emission spectrum shifts with age, a photochemical or biological effect depends strongly on wavelength, or a weighting function is to be applied. The decisive asymmetry: any band value and any weighting can be calculated afterwards from a spectrum – but no spectrum can be recovered from a band value. Which sensor design suits which task is described under selection of UV sensors.

Why uniformity and measuring position matter

A single reading describes a point, not an area. With flat samples, several specimens treated in parallel, or curved parts, it is the distribution of irradiance that decides whether every item in a batch was treated comparably. The informative figure is therefore not the mean on its own but the spread between maximum and minimum across the usable area.

Equally important is that the measuring position is fixed and written down. Working distance, sample height, angle of incidence and – for larger areas – a spatial grid turn a lamp setting into a reproducible optical boundary condition. Without those details an experiment can be repeated neither at another site nor at a later date.

Dose, irradiance and the temporal profile

Dose is irradiance integrated over time. It does not follow that every combination of intensity and duration has the same effect. In photochemical and biological processes, side reactions, oxygen diffusion, heat build-up and repair mechanisms each run on their own timescale. Short and intense is therefore not interchangeable with long and gentle.

For fast processes the temporal profile matters as well: on a conveyor the sample passes through a brief profile of rise, peak and decay. Two lines delivering the same integrated dose can produce very different peak values. Anyone transferring a process should therefore record peak irradiance, spectrum and exposure time alongside the dose.

From a reading to a comparable result

For readings to stay comparable across instruments, sites and years, the calibration has to be traceable. It links incident radiation to the displayed value – and it does so for defined conditions. Use a sensor on a type of source other than the one it was calibrated against and an additional error appears. The accredited laboratories and the quantities they cover are described under calibration laboratory, the applicable rules under guidelines, norms and standards in UV.

Instrument choice follows from the measuring task, not from a product name: spectroradiometers characterise sources and make weighted evaluation possible, radiometers capture irradiance and dose within a fixed band, the flat UVpad measures where there is little headroom, irradiation chambers provide reproducible exposure conditions, and a dose controller such as the UV-MAT runs the process on measured radiation rather than on elapsed time.

How these markets are developing technologically

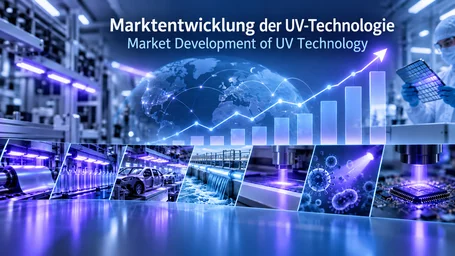
UV technology is rarely a market of its own. More often it is an enabling technology inside larger production, research and testing systems. For scale: in its Global Industry Report, SPIE put revenue from core photonics components in 2024 at roughly 379 billion US dollars. The individual UV segments – curing, disinfection, measurement – are two to three orders of magnitude smaller.

Technologically the emphasis is shifting away from picking a lamp towards integrated optical processes. UV LEDs offer narrow spectra, fast switching and locally confined energy input. Discharge lamps remain relevant wherever high power, broad spectra or established process windows are required. Alongside them, spectral measurement, inline sensors, digital interfaces and automated dose control keep gaining ground. The primary engineering figure is no longer the electrical rating of the source but the spectral radiation arriving at the point of process.

How publications connect to the applications

How optical measurement and UV irradiation are used in real research questions is best shown by the work of users. Each market page carries a small annotated selection; the complete lists, ordered by product and by topic, are collected under publications by customers and publications by topic.

A single study often belongs to more than one field, and that is intentional. Photocatalytic removal of a pharmaceutical from water sits with photocatalysis on the mechanism side and with water and environmental technology on the application side. Photocatalysis names a mechanism, water technology names an application – the two do not exclude each other.