


Anyone documenting a UV or light measurement has to name the quantity they mean. Irradiance or radiance, dose or exposure time, peak wavelength or dominant wavelength – the terms sound alike and describe different things. This glossary brings 75 optical quantities together: with symbol, unit, a short definition and a note on what they are most often confused with.
The quantities come in eight groups: spectral quantities, radiometric, photometric and colorimetric quantities, photon-based and weighted quantities, transmission and material, and geometry and measurement conditions. The search also covers symbols, units and synonyms – enter “CRI”, “lux” or “λd” and you land on the right entry.
Where a calculator converts the quantity or a knowledge page covers it in depth, the link sits right next to the entry. That makes the glossary the table of contents of the UV tools: from irradiance to the radiometry calculator, from dose to the UV dose calculator, from chromaticity to the spectral database explorer.
The glossary is for orientation; it replaces neither the text of a standard nor a measurement with calibrated instruments. The definitions are abbreviated for practical use; what counts is the wording in the currently valid edition of the rule named with the entry. Range limits are not the same everywhere either – DIN/ISO 20473, IEC 62471 and the ICNIRP guidelines set them differently in places. Wherever a figure decides a process release or a risk assessment, the original text is the one to use.
All quantities at a glance
What a wavelength is, how a spectrum is described and which characteristic values come out of it.
| Quantity | Symbol | Unit |
|---|---|---|
| Wavelength | λ | nm, µm, Å |
| Frequency | ν | Hz, THz |
| Wavenumber | ṽ | cm⁻¹ |
| Photon energy | Ep | eV, J |
| Spectral distribution | S(λ) | W/(m²·nm), oder relativ |
| Spectral irradiance | Eλ | W/(m²·nm), mW/(cm²·nm) |
| Spectral radiance | Lλ | W/(m²·sr·nm) |
| Peak wavelength | λp | nm |
| Centroid wavelength | λc | nm |
| Full width at half maximum | Δλ | nm, FWHM |
Wavelength (λ) in nm
The wavelength is the distance between two consecutive identical phases of a wave, measured in nanometres. It is linked to frequency by λ = c/ν and determines what the radiation does: a UV-C wavelength around 254 nm inactivates micro-organisms, 365 nm excites fluorescence, 395 nm cures coatings. The division into UV-C, UV-B, UV-A, visible and infrared follows DIN/ISO 20473.
Do not confuse with: A wavelength on its own does not describe a source. A "365 nm LED" emits over a band roughly 10 nm wide; only peak wavelength, centroid wavelength and full width at half maximum together describe it.
Governed by: DIN/ISO 20473 · DIN 5031-7
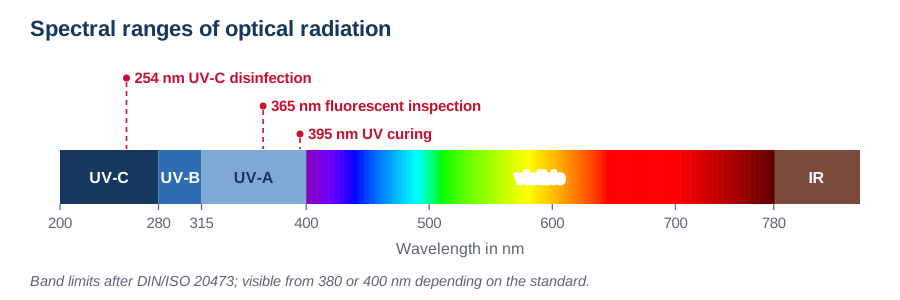
Optical radiation spans UV-C, visible light and infrared. The limits at 280, 315 and 400 nm follow DIN/ISO 20473.
Frequency (ν) in Hz
Frequency states how many wave cycles pass a point per second. In vacuum ν = c/λ with c = 299,792,458 m/s. Visible light lies around 400 to 790 THz, UV-C around 1200 THz. Unlike wavelength, frequency does not change when the radiation enters another medium.
Do not confuse with: Optical metrology almost always quotes wavelength. Frequency appears where the energy of a photon is needed: E = h·ν.
Governed by: DIN 5031-1
Wavenumber (ṽ) in cm⁻¹
The wavenumber is the number of wavelengths per centimetre: ṽ = 1/λ. A wavelength of 250 nm corresponds to 40,000 cm⁻¹. Because the wavenumber is proportional to photon energy, vibrational and molecular spectra are plotted in cm⁻¹.
Do not confuse with: Wavenumbers are unusual in UV and light metrology; they turn up when taking over data from IR and Raman spectroscopy.
Governed by: DIN 5031-1
Photon energy (Ep) in eV
Photon energy follows from E = h·ν = h·c/λ. In practice E[eV] ≈ 1239.84 / λ[nm]. A photon at 254 nm carries 4.88 eV, one at 365 nm 3.40 eV, one at 550 nm only 2.25 eV. Since typical C–C bonds lie at 3.6 eV and C–H bonds at 4.3 eV, UV-C acts photochemically where visible light does nothing.
Do not confuse with: Photon energy says whether a reaction is possible at all – not how fast it runs. That is the job of the number of photons, i.e. the photon flux.
Governed by: DIN 5031-1
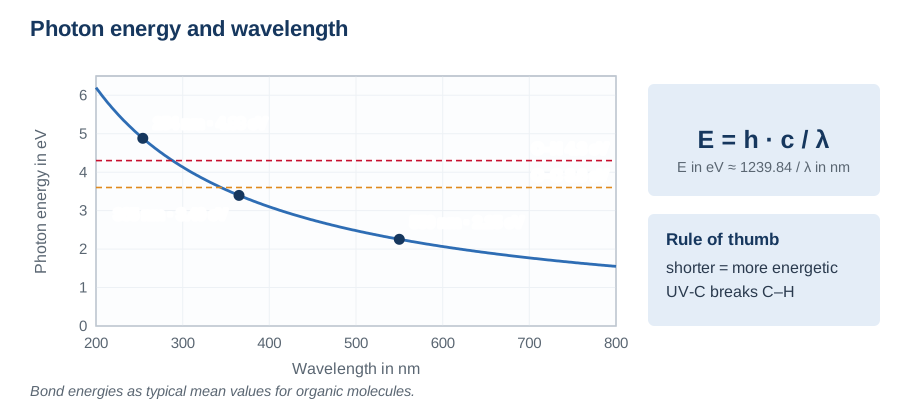
The shorter the wavelength, the more energy a photon carries. Only below about 290 nm is it enough to break C–H bonds.
Spectral distribution (S(λ)) in W/(m²·nm)
The spectral distribution S(λ) states how the radiation of a source is distributed over wavelength. It is given either in absolute terms, then it is the spectral irradiance in W/(m²·nm), or normalised relative to its maximum. Every derived quantity comes out of S(λ) by integration and weighting: irradiance by integration, illuminance by weighting with V(λ), chromaticity by weighting with the colour matching functions, effective irradiance by weighting with an action spectrum.
Do not confuse with: A broadband radiometer delivers a single number, a spectroradiometer the whole distribution. As soon as sources of different technologies are compared or the spectrum shifts through ageing, there is no way around S(λ).
Governed by: DIN 5031-1 · CIE 015
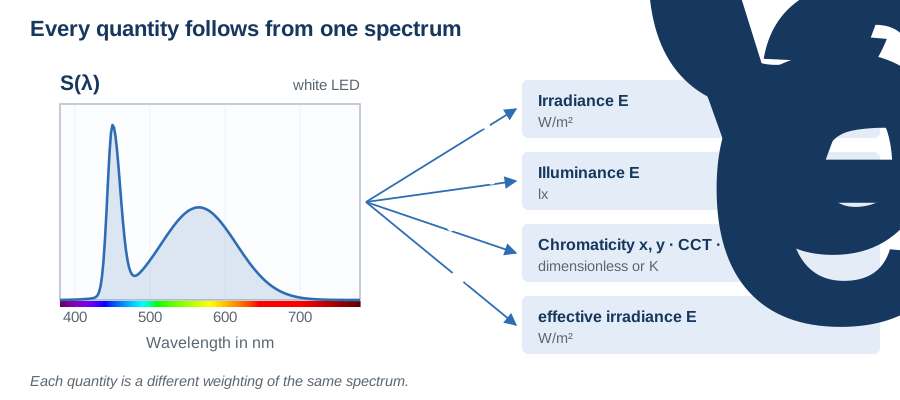
The spectral distribution is the starting point: integrated it gives irradiance, weighted with V(λ) illuminance, with the colour matching functions the chromaticity, with s(λ) the effective irradiance.
Spectral irradiance (Eλ) in W/(m²·nm)
Spectral irradiance is the quotient of the irradiance in a narrow wavelength interval and the width of that interval. It is the absolute form of the spectral distribution. Integrating over a wavelength range gives the irradiance of that range: E = ∫ Eλ dλ.
Do not confuse with: The numerical value depends on the unit of the interval. 1 W/(m²·nm) equals 1000 W/(m²·µm) – the most common factor-of-1000 error when taking over external data sheets.
Governed by: DIN 5031-1 · CIE 015
Spectral radiance (Lλ) in W/(m²·sr·nm)
Spectral radiance describes how much power a surface emits per solid angle and per wavelength interval. It is the quantity in which integrating spheres are calibrated as radiance standards, and the basis for assessing extended sources under IEC 62471.
Do not confuse with: Unlike spectral irradiance it is independent of distance – it describes the source, not the receiver.
Governed by: DIN 5031-1 · IEC 62471
Peak wavelength (λp) in nm
The peak wavelength is the wavelength of the highest spectral irradiance. It is easy to read off and therefore the usual type designation of UV LEDs. It shifts with junction temperature and drive current: for UV LEDs 1 to 3 nm over the permitted temperature range is common.
Do not confuse with: For asymmetric or multi-peaked spectra the peak wavelength says little about the effect. The centroid wavelength is the more honest figure there – and for the colour impression the dominant wavelength.
Governed by: DIN 5031-1 · CIE 127
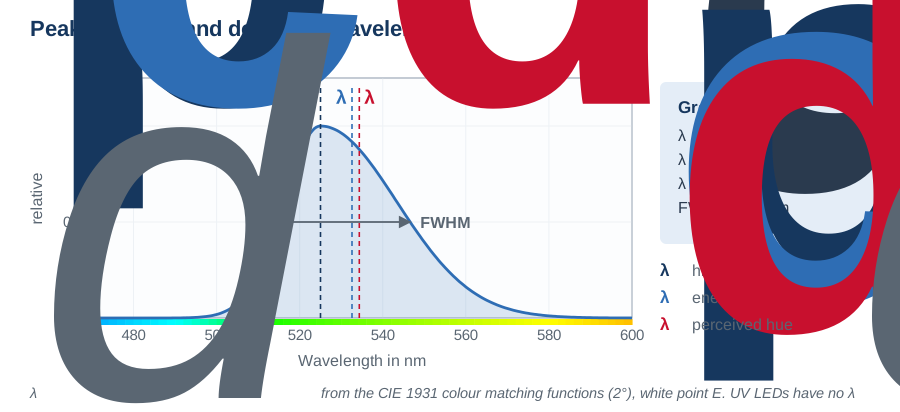
Peak, centroid and dominant wavelength of the same green LED: three figures, three different values. The full width at half maximum measures the width of the spectrum at half height.
Centroid wavelength (λc) in nm
The centroid wavelength is the mean wavelength weighted with the spectral irradiance: λc = ∫λ·Eλdλ / ∫Eλdλ. For UV LEDs it typically lies a few nanometres above the peak wavelength, because the long-wave flank tails off more slowly.
Do not confuse with: Anyone comparing readings from two instruments should check which of the two figures the data sheet quotes – the mix-up explains many apparent deviations.
Governed by: CIE 127
Full width at half maximum (Δλ) in nm
The full width at half maximum is the distance between the two wavelengths at which the spectral irradiance has fallen to half its maximum. UV LEDs typically lie between 9 and 15 nm, lasers far below, medium-pressure and xenon sources far above.
Do not confuse with: The full width at half maximum of a source must not be confused with the spectral resolution of an instrument – the instrument broadens narrow lines by its own bandwidth.
Governed by: CIE 127
Radiation assessed energetically, regardless of whether the eye can see it – the basis of every UV measurement.
| Quantity | Symbol | Unit |
|---|---|---|
| Radiant flux | Φe | W, mW |
| Radiant intensity | Ie | W/sr, mW/sr |
| Irradiance | Ee | W/m², mW/cm² (1 mW/cm² = 10 W/m²) |
| Radiance | Le | W/(m²·sr), mW/(cm²·sr) |
| Radiant exposure (dose) | He | J/m², mJ/cm² (1 mJ/cm² = 10 J/m²) |
| Radiant energy | Qe | J, Ws |
| Fluence and fluence rate | H0, E0 | J/m², W/m² |
Radiant flux (Φe) in W
Radiant flux, also called radiant power, is the total amount of energy a source radiates per unit time in all directions. It is measured in an integrating sphere. A 60 watt incandescent lamp emits about 57 W as radiant flux, spread over the visible and infrared spectrum.
Do not confuse with: Radiant flux is not the electrical power input. Between the two lies the electro-optical efficiency, which for UV LEDs ranges from a few to a few dozen per cent depending on wavelength.
Governed by: DIN 5031-1 · ISO 80000-7
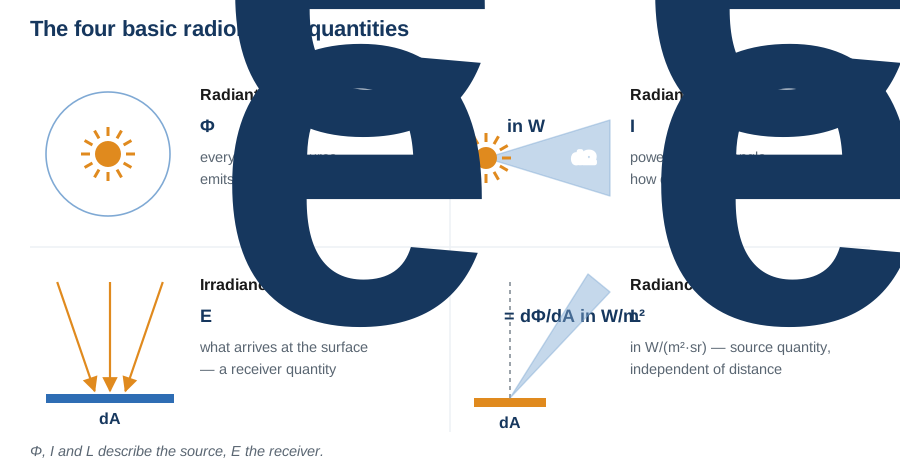
The same radiation, four references: in total (Φ), per solid angle (I), per receiver area (E) and per solid angle and projected source area (L).
Radiant intensity (Ie) in W/sr
Radiant intensity is the quotient of the radiant flux emitted in a given direction and the solid angle element. An LED with a radiant flux of 1 W emitted into 0.1 sr reaches 10 W/sr. Radiant intensity thus describes the directional distribution plotted in beam pattern diagrams.
Do not confuse with: Irradiance follows from radiant intensity only via the inverse-square law E = I/r² – and that holds only beyond the photometric limiting distance.
Governed by: DIN 5031-1 · ISO 80000-7
Irradiance (Ee) in W/m²
Irradiance is the quotient of the radiant power incident on a surface element and the size of that element. It is the central process quantity of every UV application and is measured with a radiometer. On a clear day the sun reaches about 1000 W/m² at the earth's surface.
Do not confuse with: Irradiance is a receiver quantity and depends on distance; radiance is a source quantity and does not. Data sheets often quote irradiance without the distance – without it the figure is worthless.
Governed by: DIN 5031-1 · ISO 80000-7
Radiance (Le) in W/(m²·sr)
Radiance is the quotient of the emitted radiant flux and the product of area element and solid angle. It describes what a source emits per area and solid angle and stays constant as you move away from the source. For assessing extended sources under IEC 62471 it is the decisive quantity.
Do not confuse with: For releasing a process the irradiance at the point of action counts; for the risk assessment of extended sources it is radiance. The two quantities answer different questions.
Governed by: DIN 5031-1 · IEC 62471
Radiant exposure (dose) (He) in J/m²
Radiant exposure is the time integral of irradiance. At constant irradiance H = E · t. It is the quantity that decides the success of a UV process: curing, disinfection and ageing are dose processes. Irradiance only determines how fast the dose is reached.
Do not confuse with: A time on its own is no proof. Both quantities – irradiance and dose – belong separately in the documentation, because an ageing lamp delivers the same time at a lower dose.
Governed by: DIN 5031-1 · ISO 80000-7
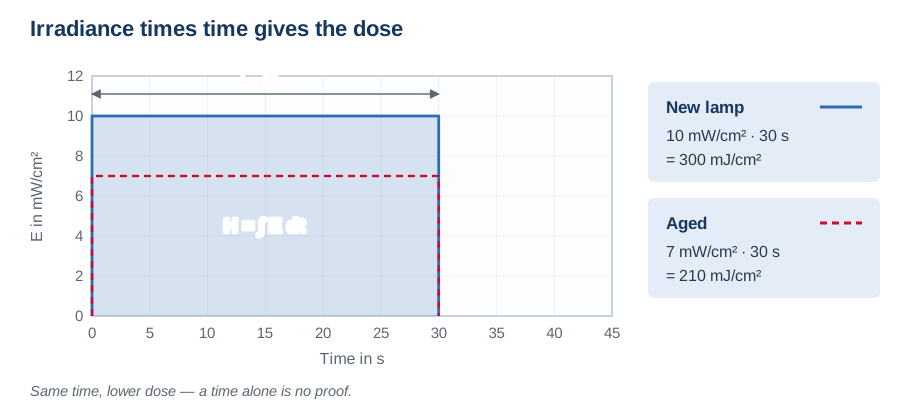
Dose is the area under irradiance over time. An aged lamp needs longer for the same dose.
Radiant energy (Qe) in J
Radiant energy is the time integral of radiant flux: Q = ∫Φ dt. It is the base quantity from which the other radiometric quantities follow by referring to time, area and solid angle. For flash lamps and pulsed systems it is the natural figure per pulse.
Do not confuse with: Radiant energy describes the source as a whole, whereas radiant exposure describes what arrives at a particular surface.
Governed by: DIN 5031-1 · ISO 80000-7
Fluence and fluence rate (H0, E0) in J/m², W/m²
Fluence rate is the radiant power per cross-sectional area referred to a small sphere; fluence is its time integral. Unlike radiant exposure, which refers to a flat surface and weights obliquely incident radiation with the cosine, radiation from all directions counts in full here. In UV disinfection, fluence is the physically correct dose quantity for a micro-organism in water.
Do not confuse with: In a directed radiation field fluence and radiant exposure agree; in a diffuse field fluence can be considerably larger than the exposure measured on a plane.
Governed by: DVGW W 294 · DIN 19294
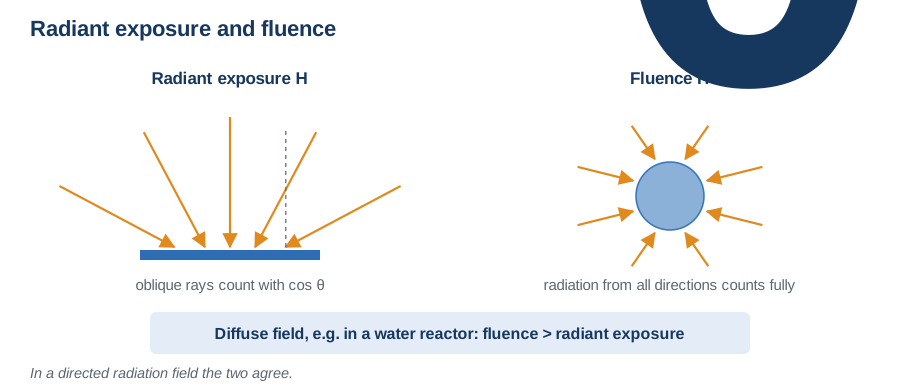
A flat surface weights oblique radiation with the cosine, a small sphere receives it fully from all directions. In the diffuse field of a water reactor, fluence is therefore larger than radiant exposure.
The same quantities weighted with the eye's luminous efficiency function V(λ): lumen, lux, candela.
| Quantity | Symbol | Unit |
|---|---|---|
| Luminous flux | Φv | lm, Lumen |
| Luminous intensity | Iv | cd, Candela = lm/sr |
| Illuminance | Ev | lx, Lux = lm/m² |
| Luminance | Lv | cd/m², Nit |
| Luminous exposure | Hv | lx·s, lx·h |
| Luminous efficacy | η | lm/W |
| Luminous efficiency function | V(λ) | —, V′(λ) |
| Luminous efficacy constant | Km | lm/W |
| Photometric limiting distance | rmin | m |
Luminous flux (Φv) in lm
Luminous flux is the radiant power weighted with the luminous efficiency function V(λ), measured in lumen. It covers all directions and is therefore the measure of a light source's total brightness. A 60 watt incandescent lamp delivers about 900 lm; an LED lamp of the same brightness needs around 10 W.
Do not confuse with: For UV radiation luminous flux is meaningless: V(λ) is zero below 380 nm. A UV source has zero lumen regardless of its power.
Governed by: DIN 5031-3 · ISO 80000-7
Luminous intensity (Iv) in cd
Luminous intensity is the quotient of the luminous flux emitted in one direction and the solid angle element. It is measured in candela, the SI base unit of photometry. A powerful torch reaches 1000 cd along the beam.
Do not confuse with: Candela describes one direction, lumen the whole source. A lamp with a high candela figure can have few lumen if it is tightly focused.
Governed by: DIN 5031-3 · ISO 80000-7
Illuminance (Ev) in lx
Illuminance is the quotient of the incident luminous flux and the area, measured in lux. It is the photometric counterpart of irradiance. Around 500 lx is recommended in offices; outdoors on a sunny day 100,000 lx is reached.
Do not confuse with: Lux cannot be converted to W/m² in general. The factor depends on the spectrum – the conversion is admissible only for a known source with a measured spectral distribution.
Governed by: DIN 5031-3 · DIN EN 12464-1
Luminance (Lv) in cd/m²
Luminance is the quotient of the emitted luminous flux and the product of area element and solid angle. It is the only photometric quantity that corresponds directly to the brightness impression, and it is independent of distance. A computer display typically lies at 300 cd/m².
Do not confuse with: Luminance measurements depend on the measuring field angle: too large a spot averages in the background and reads too low.
Governed by: DIN 5031-3 · ISO 80000-7
Luminous exposure (Hv) in lx·s
Luminous exposure is the time integral of illuminance and thus the photometric counterpart of radiant exposure. It appears wherever a light-induced change is cumulative: in pharmaceutical photostability testing, in museum lighting and in the fading of colours.
Do not confuse with: ICH Q1B additionally requires a UV dose of at least 200 W·h/m² in the near UV – the lux·h alone are not enough.
Governed by: DIN 5031-3 · ICH Q1B
Luminous efficacy (η) in lm/W
Luminous efficacy is the quotient of luminous flux and electrical power input. Incandescent lamps reach around 15 lm/W, fluorescent lamps 60 to 100 lm/W, white LEDs today over 150 lm/W. The theoretical upper limit is 683 lm/W for monochromatic radiation at 555 nm.
Do not confuse with: The luminous efficacy of a lamp refers to electrical power, the luminous efficacy of radiation to radiant flux – two different numbers with the same unit.
Governed by: DIN 5031-3
Luminous efficiency function (V(λ))
V(λ) describes the spectral sensitivity of the eye in photopic vision. It peaks at 555 nm, falls to nearly zero at 380 and 780 nm and has been defined by the CIE since 1924. V′(λ) applies to scotopic vision with its maximum at 507 nm. Every photometric quantity is the V(λ)-weighted version of its radiometric counterpart.
Do not confuse with: How closely a lux meter reproduces V(λ) is described by the spectral mismatch f₁′. With LED light a poor match has a stronger effect than with incandescent light.
Governed by: CIE 018 · DIN 5031-3
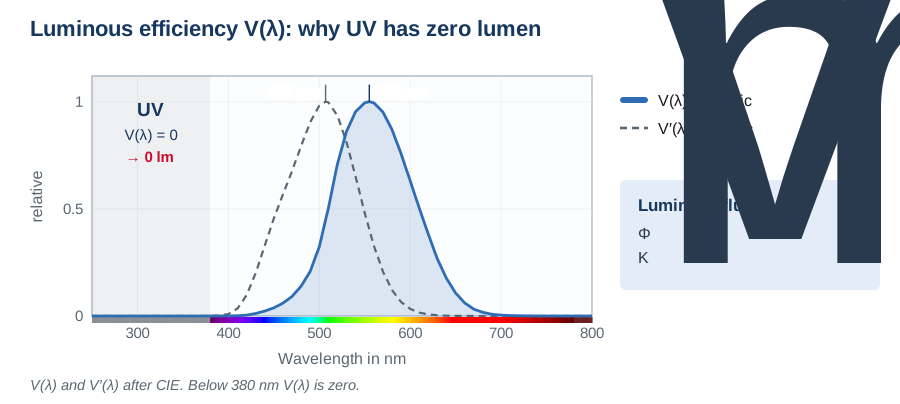
Photometric quantities weight radiation with the eye's luminous efficiency. Below 380 nm V(λ) is zero – a UV source therefore has practically no luminous flux, and a lux meter does not measure UV.
Luminous efficacy constant (Km) in lm/W
Km = 683 lm/W is the conversion factor between radiant power and luminous flux at the peak of the luminous efficiency function at 555 nm. Luminous flux follows from Φv = Km · ∫Φe,λ·V(λ)dλ. Since the 2019 SI revision the candela is defined via this numerical value.
Do not confuse with: 683 lm/W applies only at 555 nm. For any real source the conversion factor is lower, and it depends on the spectrum.
Governed by: SI-Einheitensystem · CIE 018
Photometric limiting distance (rmin) in m
The photometric limiting distance is the minimum distance beyond which the error of the inverse-square law stays below a defined limit. As a rule of thumb it is five to ten times the largest luminous dimension; for a 1 % error limit it is ten times. Below that the source is no longer a point source.
Do not confuse with: Within the limiting distance – directly under a UV LED array or an area luminaire – irradiance falls off far more slowly than 1/r². Applying the inverse-square law there is considerably wrong.
Governed by: DIN 5032-1
Chromaticity, colour temperature, colour rendering – what a spectroradiometer says about the colour of a light source.
| Quantity | Symbol | Unit |
|---|---|---|
| Tristimulus values | X, Y, Z | — |
| Standard observer (2° and 10°) | CIE 1931 / CIE 1964 | — |
| Chromaticity coordinates | x, y | — |
| CIE 1960 UCS chromaticity | u, v | — |
| CIE 1976 UCS chromaticity | u′, v′ | — |
| CIELAB colour space | L*, a*, b* | — |
| DIN99 colour space (Lab99) | L99, a99, b99 | — |
| Colour difference | ΔE | — |
| Colour temperature and correlated colour temperature | T, Tn | K, CCT |
| Distance from the Planckian locus | Δuv | — |
| General colour rendering index | Ra | —, CRI |
| Special colour rendering indices | R1 bis R15 | — |
| Fidelity index of IES TM-30 | Rf | — |
| Gamut index of IES TM-30 | Rg | — |
| Saturation and chroma | S, C* | — |
| Hue angle | h | °, hab |
| Dominant wavelength | λd | nm |
| Colour purity | pe | % |
| MacAdam ellipse | SDCM | Stufen |
Tristimulus values (X, Y, Z)
The tristimulus values arise by weighting the spectral distribution with the three colour matching functions x̄(λ), ȳ(λ) and z̄(λ) and integrating: X = k·∫S(λ)·x̄(λ)dλ, likewise for Y and Z. Y is defined so that it corresponds to brightness – for light sources Y is proportional to illuminance. Every other colorimetric quantity is a conversion from X, Y and Z.
Do not confuse with: Two spectra with identical tristimulus values look alike although they differ physically – that is metamerism. This is why chromaticity alone is not enough to judge a light source; colour rendering belongs with it.
Governed by: CIE 015 · DIN 5033-2
Standard observer (2° and 10°) (CIE 1931 / CIE 1964)
The 2° standard observer (CIE 1931) describes colour vision in a two-degree field, as when looking at a small area from normal distance. The 10° standard observer (CIE 1964) applies to larger fields and describes extended areas better. Both give slightly different chromaticities for the same spectrum; the difference is largest for narrow-band LED spectra.
Do not confuse with: Chromaticities, colour temperatures and colour differences from different observers must not be compared. Which one was used belongs in every measurement record.
Governed by: CIE 015 · DIN 5033-2 · ISO/CIE 11664-1
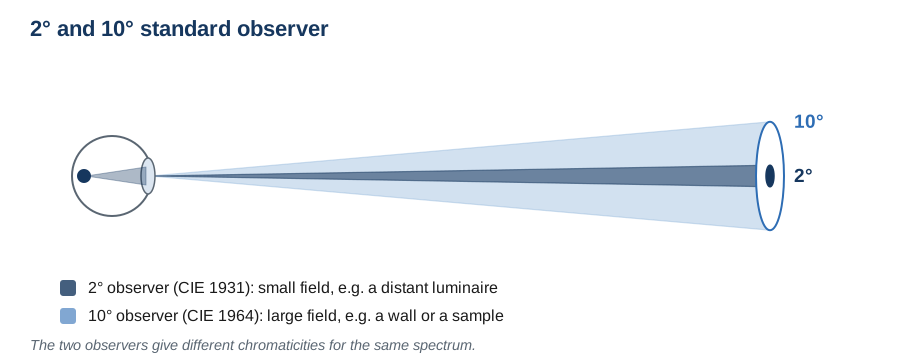
The 2° observer (CIE 1931) applies to small fields, the 10° observer (CIE 1964) to large ones. Colour values are comparable only when the observer is stated.
Chromaticity coordinates (x, y)
Chromaticity coordinates arise by normalising the tristimulus values to their sum: x = X/(X+Y+Z), y = Y/(X+Y+Z). The pair describes the chromaticity independently of brightness and is plotted in the horseshoe-shaped chromaticity diagram. White points lie around x = 0.33, y = 0.33.
Do not confuse with: The chromaticity diagram is not perceptually uniform: in the green region the same geometric distance means a far smaller perceived difference than in the blue. For distance assessments u′v′ or CIELAB should be used instead.
Governed by: CIE 015 · DIN 5033-3
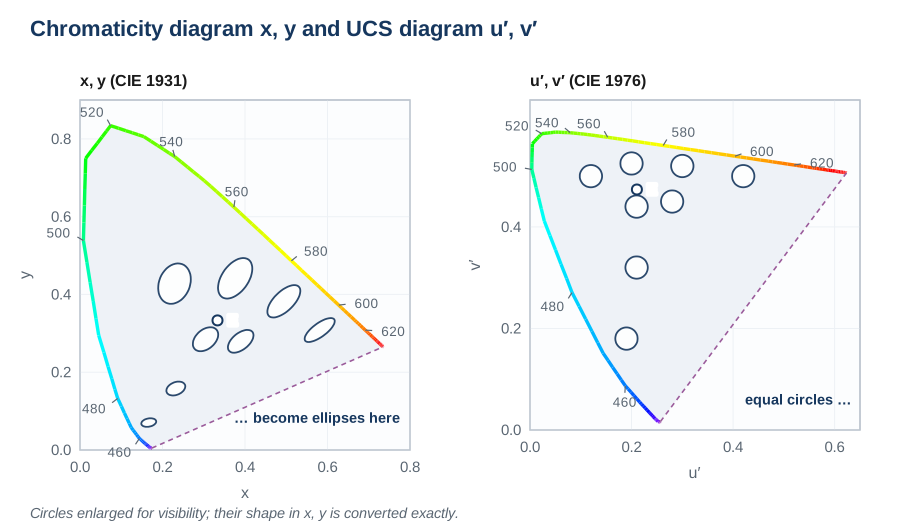
The x, y chromaticity diagram and the u′, v′ UCS diagram show the same colours. In u′, v′, equal distances correspond more closely to equal perceived colour differences.
CIE 1960 UCS chromaticity (u, v)
The CIE 1960 UCS diagram results from the transformation u = 4X/(X+15Y+3Z) and v = 6Y/(X+15Y+3Z). It was superseded by u′v′ in 1976 but is still needed: correlated colour temperature and the distance Δuv from the Planckian locus are defined in this diagram to this day.
Do not confuse with: u is identical in both diagrams, v is not: v′ = 1.5·v. Mixing up the values gives a wrong colour temperature.
Governed by: CIE 015 · DIN 5033-3
CIE 1976 UCS chromaticity (u′, v′)
The chromaticity in the CIE 1976 UCS diagram follows from u′ = 4X/(X+15Y+3Z) and v′ = 9Y/(X+15Y+3Z). The diagram is considerably more uniform than the xy diagram: a distance Δu′v′ of 0.0054 roughly corresponds to the discrimination threshold everywhere. It is the usual measure for the spread of LED batches and the tolerance specification of luminaires.
Do not confuse with: Uniform does not mean exact: u′v′ too only approximates perception. For object colours CIELAB is the more accurate choice.
Governed by: CIE 015 · ISO/CIE 11664-5
CIELAB colour space (L*, a*, b*)
The CIELAB colour space maps the tristimulus values onto three axes via a cube-root function: L* for lightness from 0 to 100, a* for red versus green, b* for yellow versus blue. The conversion requires a reference white, usually standard illuminant D65 or D50. The Euclidean distance between two points is the colour difference ΔE*ab.
Do not confuse with: CIELAB describes object colours under an illumination, not the light source itself. For light sources, chromaticity, colour temperature and colour rendering are the appropriate quantities.
Governed by: ISO/CIE 11664-4 · DIN EN ISO 11664-4
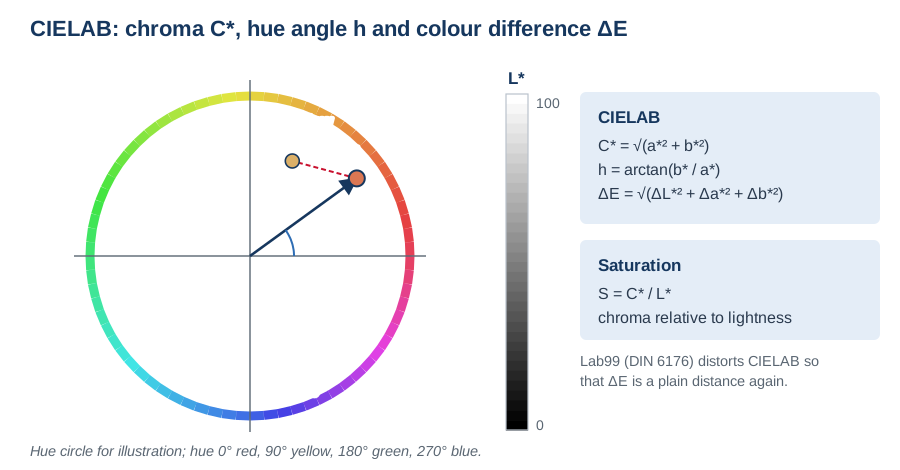
In the a*b* plane, chroma C* is the distance from the origin and hue angle h the direction. The colour difference ΔE*ab is the distance between two points in L*a*b* space.
DIN99 colour space (Lab99) (L99, a99, b99)
The DIN99 colour space of DIN 6176 distorts CIELAB so that perceptual uniformity is achieved without the complicated weighting functions of ΔE00. The colour difference is then simply the Euclidean distance ΔE99. It is used above all in the coatings, textile and automotive industries.
Do not confuse with: There are several variants (DIN99, DIN99b, DIN99c, DIN99d). Which one was used must be stated, otherwise the figures are not comparable.
Governed by: DIN 6176
Colour difference (ΔE)
The colour difference is the distance between two chromaticities in a uniform colour space. ΔE*ab is the Euclidean distance in CIELAB, ΔE00 the refined CIEDE2000 formula with weighting functions for lightness, chroma and hue. A ΔE of 1 counts as a just noticeable difference; in industrial practice a ΔE below 3 is usually regarded as sufficient.
Do not confuse with: Which formula applies must be stated: ΔE*ab, ΔE94, ΔE00 and ΔE99 give different numbers for the same two colours.
Governed by: ISO/CIE 11664-4 · ISO/CIE 11664-6 · DIN 6176
Colour temperature and correlated colour temperature (T, Tn) in K
Colour temperature T is the temperature of a Planckian radiator whose chromaticity matches that of the source. Since that is almost never exactly the case for real lamps, correlated colour temperature Tn (CCT) is used: the temperature of the Planckian radiator at the smallest distance in the CIE 1960 UCS diagram. Warm white lies around 2700 to 3000 K, neutral white at 4000 K, daylight white above 5300 K.
Do not confuse with: Correlated colour temperature is only meaningful as long as the chromaticity lies close to the Planckian locus – the usual criterion is |Δuv| ≤ 0.005. Further away, two sources with the same CCT describe visibly different colours.
Governed by: DIN 5031-8 · CIE 015 · ANSI C78.377
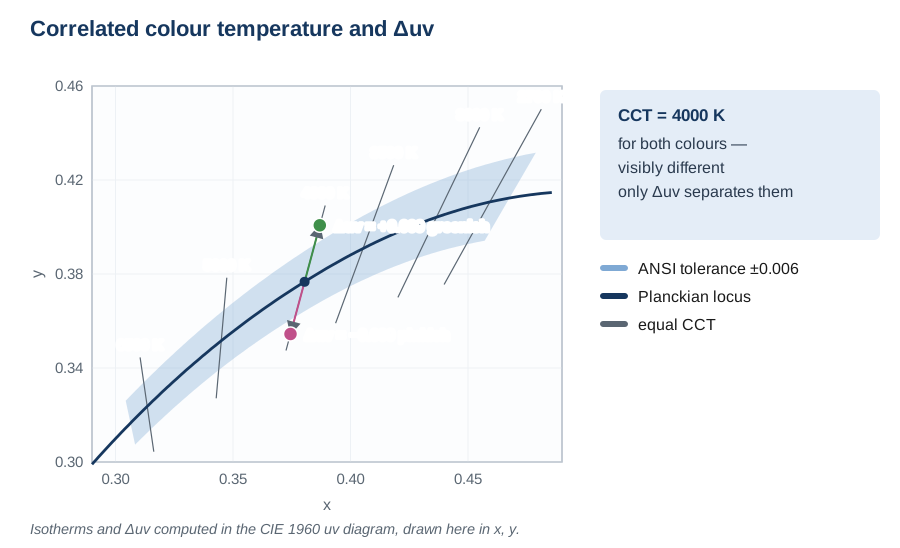
The correlated colour temperature is read off the isotherm, Δuv gives the distance from the Planckian locus. Two sources with the same CCT can look greenish or pinkish.
Distance from the Planckian locus (Δuv)
Δuv is the perpendicular distance of the chromaticity from the Planckian locus in the CIE 1960 UCS diagram, with sign: positive values lie above the locus and appear greenish, negative ones below and appear pinkish. ANSI C78.377 limits the permissible deviation for white LED products to ±0.006.
Do not confuse with: Two lamps with the same colour temperature can differ noticeably in Δuv and then look visibly different. Quoting CCT without Δuv is incomplete.
Governed by: ANSI C78.377 · DIN 5031-8
General colour rendering index (Ra)
The general colour rendering index of CIE 13.3:1995 compares the chromaticities of eight standardised test colours under the source under test with those under a reference source of the same colour temperature – a Planckian radiator below 5000 K, a daylight illuminant above. From the mean colour difference follows Ra = 100 − 4.6·ΔE̅. Values above 90 count as very good, below 80 as inadequate for interiors.
Do not confuse with: Ra is an average over eight weakly saturated colours. An LED can reach Ra 85 and still render saturated red dull – that is what R9 is for. For narrow-band sources TM-30 is the more informative method.
Governed by: CIE 13.3:1995 · DIN 6169
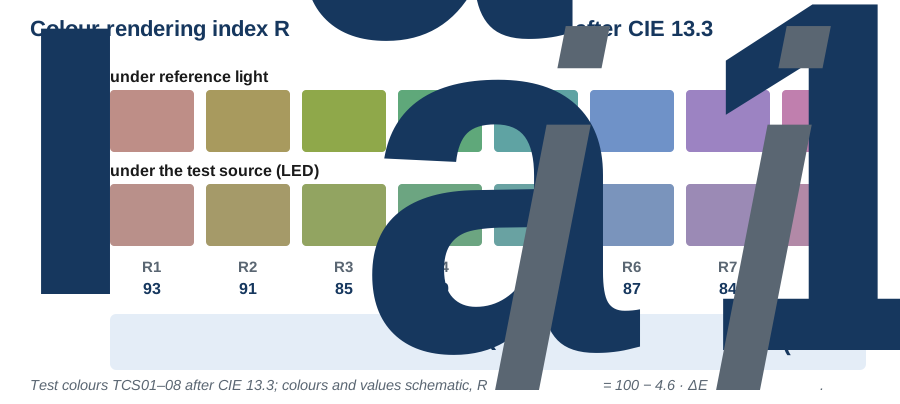
Ra is the mean of the special indices R1 to R8: eight moderately saturated test colours, each compared under reference and test light.
Special colour rendering indices (R1 bis R15)
R1 to R8 are the eight weakly saturated test colours from which Ra is averaged. R9 to R15 are additional: R9 saturated red, R10 saturated yellow, R11 saturated green, R12 saturated blue, R13 light skin tone, R14 leaf green, R15 Asian skin tone. R9 is the critical value: for white LEDs with a weak red component it often drops below 20 without Ra collapsing noticeably.
Do not confuse with: Special indices can become negative. Anyone judging meat, textiles or skin should ask for R9, R13 and R15 rather than relying on Ra.
Governed by: CIE 13.3:1995 · DIN 6169
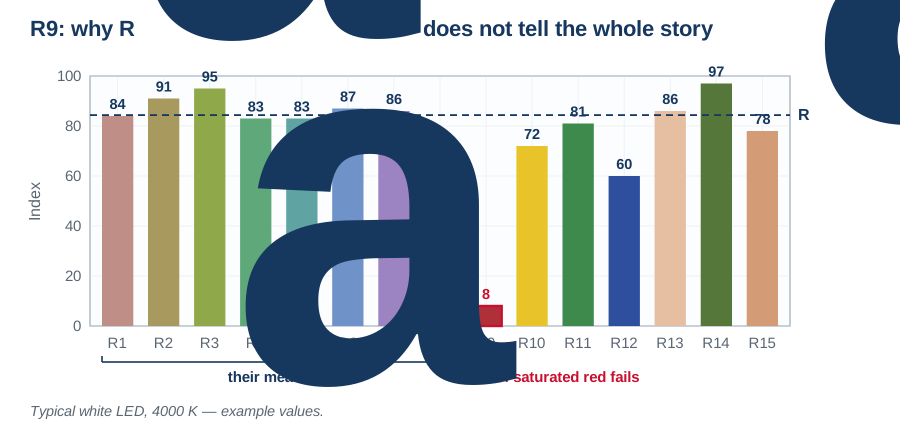
A high Ra can hide a weak R9. Saturated red does not enter the average at all.
Fidelity index of IES TM-30 (Rf)
Rf of IES TM-30-15 assesses how accurately a light source renders colours compared with the reference. Unlike Ra, the index rests on 99 colour samples that cover real surfaces and the whole colour space evenly, and it computes in the uniform CAM02-UCS. The scale runs from 0 to 100.
Do not confuse with: Rf and Ra are not the same number and cannot be converted into one another. Rf usually comes out somewhat lower for narrow-band sources and matches perception better.
Governed by: IES TM-30-15 · ANSI/IES TM-30-20 · CIE 224:2017
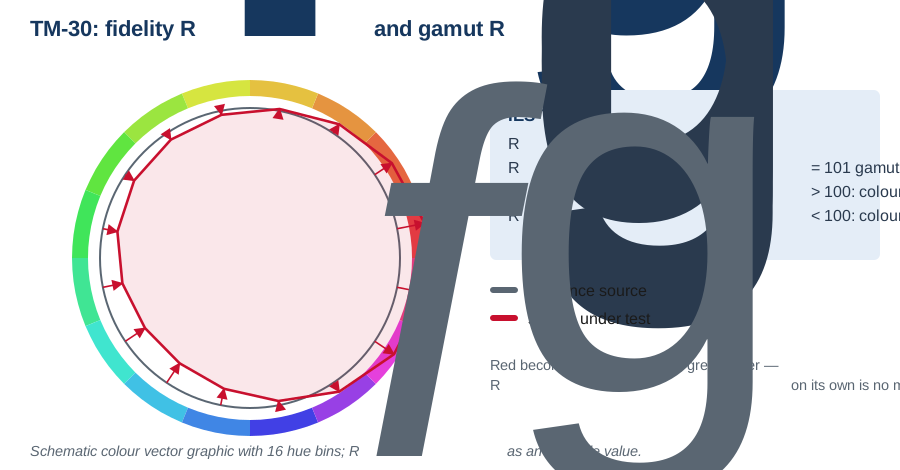
Rf rates colour fidelity over 99 test colours, Rg the saturation. The colour vector graphic shows in which hue bins a source shifts colours.
Gamut index of IES TM-30 (Rg)
Rg compares the area spanned by the 99 test colours in colour space under the test and the reference source. Values above 100 mean colours appear more saturated, values below that they appear paler. Typically Rg lies between 60 and 140.
Do not confuse with: Rg on its own is not a quality: a high value can come from oversaturated red that catches the eye but is not faithful. Only Rf and Rg together with the colour vector graphic give a picture.
Governed by: IES TM-30-15 · ANSI/IES TM-30-20
Saturation and chroma (S, C*)
Chroma C* is the distance of a colour from the neutral axis: C*ab = √(a*² + b*²) in CIELAB. Saturation S relates this chroma to lightness, S = C*/L*, and thus describes the colour impression independently of how bright the colour is. Together with hue angle h it gives the polar representation of the CIELAB space.
Do not confuse with: Chroma and saturation are treated as the same in everyday use but are not: two areas of equal saturation at different lightness have different chroma.
Governed by: ISO/CIE 11664-4 · DIN 5033-1
Hue angle (h) in °
The hue angle is the polar angle of the colour in the a*b* plane of CIELAB: hab = arctan(b*/a*), given from 0 to 360 degrees. It separates hue from lightness and chroma and is therefore the quantity people talk about when they talk about colour: "a little more yellowish" means a larger hue angle.
Do not confuse with: Close to the neutral axis the hue angle becomes indeterminate: at very low chroma it fluctuates strongly without the colour impression changing.
Governed by: ISO/CIE 11664-4 · DIN 5033-1
Dominant wavelength (λd) in nm
The dominant wavelength is obtained geometrically: a straight line is drawn from the white point through the chromaticity of the source and extended to the spectrum locus of the chromaticity diagram. The wavelength of the intersection is λd. It describes the perceived hue and is therefore the decisive binning quantity for coloured LEDs.
Do not confuse with: Peak wavelength and dominant wavelength are not the same and can differ by several nanometres for an LED: λp comes from the physics of the spectrum, λd from perception. For purple colours there is no intersection; the complementary wavelength is given instead.
Governed by: CIE 015 · DIN 5033-3
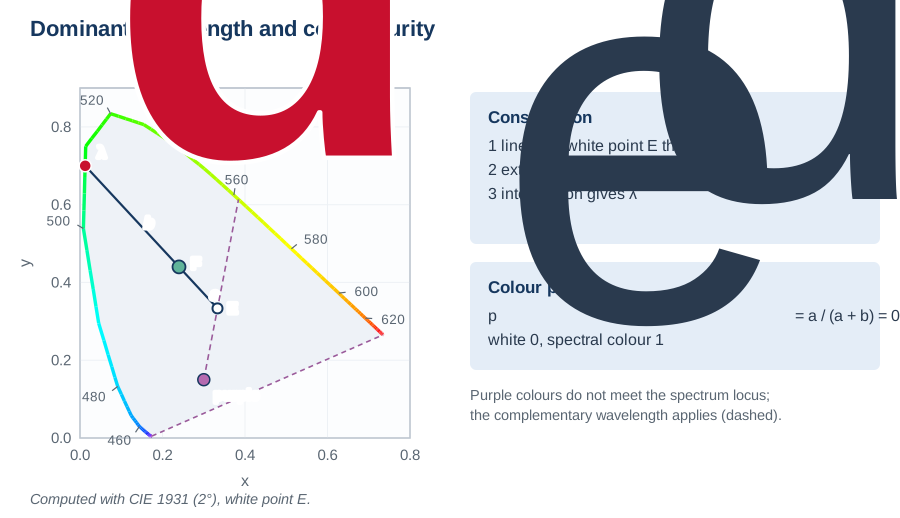
The line from the white point through the chromaticity meets the spectral locus at the dominant wavelength. How far out the chromaticity lies on this line is the colorimetric purity.
Colour purity (pe) in %
Colour purity is the ratio of the distance white point to chromaticity and the distance white point to spectrum locus along the same line that yields the dominant wavelength. White has 0 %, a pure spectral colour 100 %. Together with λd it describes the colour impression completely, apart from brightness.
Do not confuse with: There are two definitions: excitation purity via the chromaticity diagram and colorimetric purity via the tristimulus values. The numerical values differ.
Governed by: CIE 015 · DIN 5033-3
MacAdam ellipse (SDCM) in Stufen
MacAdam ellipses describe the regions in the chromaticity diagram within which two chromaticities cannot be distinguished. One step (1 SDCM, standard deviation of colour matching) is the ellipse of that discrimination threshold. Luminaires are typically supplied in 3- or 5-step tolerance; demanding applications call for 3 steps or fewer.
Do not confuse with: The step figure applies to chromaticity, not to colour rendering. Two LEDs in the same 3-step bin can differ considerably in R9.
Governed by: ANSI C78.377 · IEC 60081
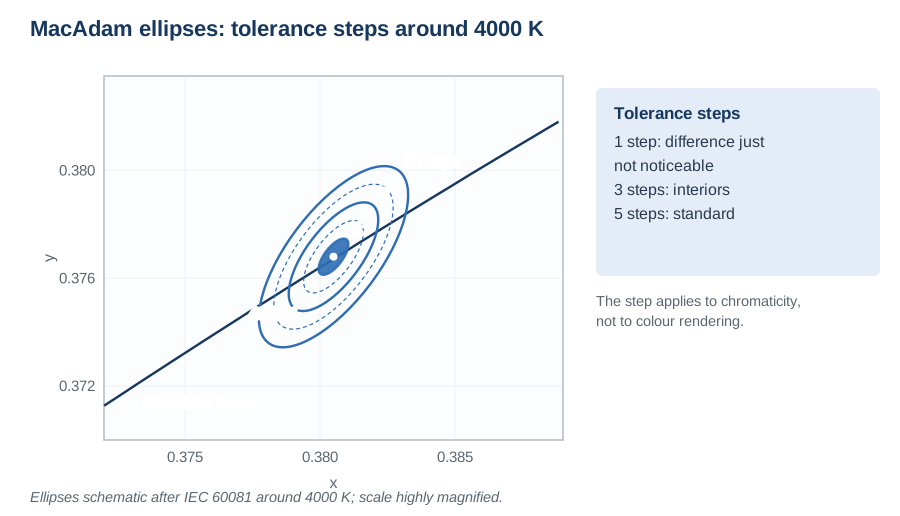
Within a 1-step ellipse, colour differences are barely perceptible. LED datasheets often give the binning tolerance as 3 or 5 steps.
Not energy but particle count – the view taken in photochemistry and horticultural lighting.
| Quantity | Symbol | Unit |
|---|---|---|
| Photon flux | Φp | µmol/s, Photonen/s |
| Photosynthetic photon flux density (PPFD) | PPFD | µmol/(m²·s) |
| Photosynthetically active radiation (PAR) | PAR | —, 400–700 nm |
| Yield photon flux (YPF) | YPF | µmol/s |
| Daily light integral (DLI) | DLI | mol/(m²·d) |
| Quantum yield | Φ | — |
Photon flux (Φp) in µmol/s
Photon flux counts light quanta, not their energy. It follows from radiant flux via Φp = Φe·λ/(h·c·NA). Wherever a reaction proceeds per absorbed photon – in photochemistry, photopolymerisation and photosynthesis – the photon count is the correct reference, not the watt.
Do not confuse with: The conversion between watt and µmol depends on wavelength: a photon at 660 nm carries only half the energy of one at 330 nm. Without a known spectrum the conversion is not unique.
Governed by: DIN 5031-1
Photosynthetic photon flux density (PPFD) (PPFD) in µmol/(m²·s)
Photosynthetic photon flux density states how many photons in the 400 to 700 nm range hit one square metre per second. It is the counterpart of irradiance in photon counting and is measured with a quantum sensor. Sunlight reaches up to 2000 µmol/(m²·s) at midday; greenhouse lighting is typically 200 to 800.
Do not confuse with: Converting PPFD to lux is inadmissible: lux weights with the eye's sensitivity, which counts almost nothing in the red and blue – exactly where plants work.
Governed by: ASABE S640
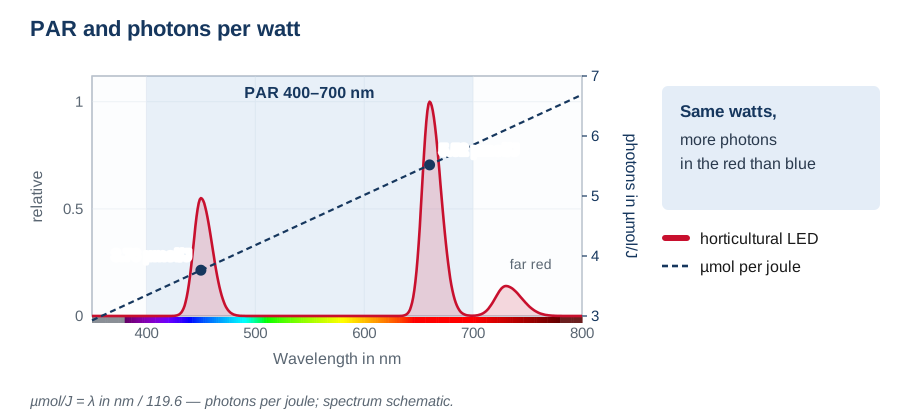
One watt of red light contains more photons than one watt of blue. For plants, the photon count matters, so PPFD is measured in µmol/(m²·s) instead of W/m².
Photosynthetically active radiation (PAR) (PAR)
PAR denotes the spectral range from 400 to 700 nm in which chlorophyll uses photons for photosynthesis. PAR is therefore not a measured value but the range to which PPFD, PPF and DLI refer. Extended definitions use ePAR up to 750 nm to capture the Emerson effect in the far red.
Do not confuse with: "PAR watts" is an unclear figure: it usually means irradiance in the PAR range, not photon flux density. When comparing luminaires it is worth checking which of the two is meant.
Governed by: ASABE S640
Yield photon flux (YPF) (YPF) in µmol/s
YPF weights each photon with the relative quantum yield curve after McCree, which peaks in the red around 620 nm and dips in the green. It describes photosynthetic performance more accurately than the unweighted PPF, but is quoted less often because the curve was derived from short-term leaf measurements of individual species.
Do not confuse with: YPF and PPFD are not comparable. Anyone comparing luminaires must use the same quantity.
Governed by: ASABE S640
Daily light integral (DLI) (DLI) in mol/(m²·d)
The daily light integral is the time integral of PPFD over 24 hours, given in mol photons per square metre and day. At constant lighting DLI = PPFD · t / 10⁶ with t in seconds. Lettuce gets by with 12 to 17 mol/(m²·d), tomatoes demand more than 20.
Do not confuse with: DLI relates to PPFD as dose relates to irradiance: the same daily amount can be reached with much light over a short time or little light over a long time – biologically that is not always equivalent.
Governed by: ASABE S640
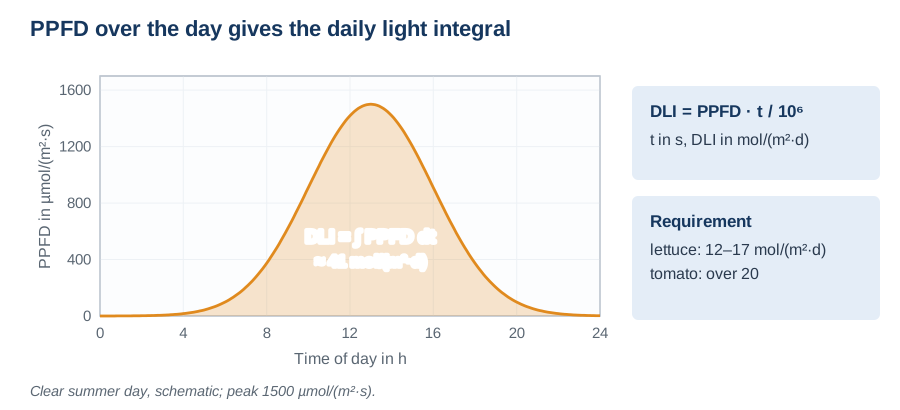
The daily light integral is the area under PPFD over 24 hours, in mol/(m²·d).
Quantum yield (Φ)
Quantum yield is the ratio of the number of molecules converted to the number of photons absorbed. Values below one are the rule; in chain reactions such as radical photopolymerisation it can be far above. It links the measured dose to the chemical conversion and explains why two formulations cure to different degrees at the same dose.
Do not confuse with: Quantum yield is a property of the system of photoinitiator, matrix and wavelength – it cannot be read off an instrument and cannot be transferred from one application to the next.
Governed by: IUPAC Gold Book
Radiation weighted with an action spectrum: erythemally effective, germicidal, actinic.
| Quantity | Symbol | Unit |
|---|---|---|
| Action spectrum | s(λ) | — |
| Effective irradiance | Eeff | W/m², mW/cm² |
| Erythemally effective irradiance and UV index | Eer, UVI | W/m² |
| Germicidally effective exposure | Hgerm | J/m², mJ/cm² |
| Blue-light weighted radiance | LB | W/(m²·sr) |
| Actinic UV hazard | ES | W/m² |
| UV-A irradiance | EUVA | W/m² |
| Exposure limit value | Heff | J/m² |
| Curing dose | HUV | mJ/cm², J/m² |
Action spectrum (s(λ))
An action spectrum weights wavelengths by their biological or chemical effectiveness, normalised to its maximum. Well-known examples are the erythema action spectrum, the germicidal action spectrum, the actinic hazard function of IEC 62471 and the luminous efficiency function V(λ) – that too is an action spectrum, namely the one for vision.
Do not confuse with: The symbol S(λ) is used twice over: in IEC 62471 it is the actinic hazard function, in radiometry the spectral distribution of a source. The context has to make clear which is meant.
Governed by: IEC 62471 · ISO/CIE 17166 · CIE 015
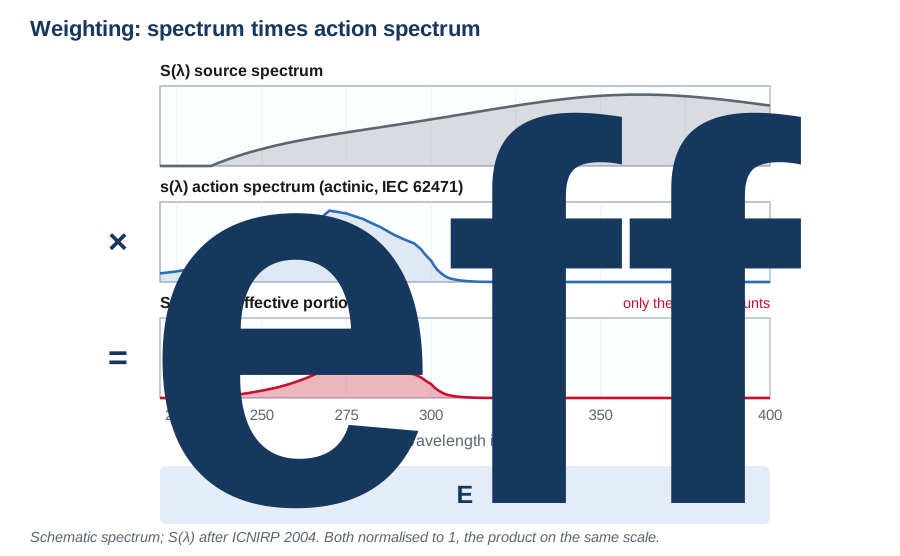
Effective irradiance arises by multiplying the source spectrum by the action spectrum, wavelength by wavelength. Only the part where the two overlap remains.
Effective irradiance (Eeff) in W/m²
Effective irradiance arises by weighting the spectral irradiance with an action spectrum and integrating: Eeff = ∫Eλ·s(λ)dλ. Only in this way can sources with different spectra be compared with respect to an effect. Almost every occupational exposure limit and the dose requirements in UV disinfection refer to such a weighted quantity; the exception is the unweighted UV-A limit.
Do not confuse with: An effective irradiance without stating the action spectrum is meaningless. The same lamp has three different values erythemally, germicidally and actinically.
Governed by: IEC 62471 · DIN EN 14255-1 · OStrV
Erythemally effective irradiance and UV index (Eer, UVI) in W/m²
Erythemally effective irradiance weights the radiation with the erythema action spectrum of ISO/CIE 17166, which peaks in the UV-B and falls by several orders of magnitude in the UV-A. The UV index is the value referred to 25 mW/m²: UVI = Eer[W/m²] · 40. A UV index of 8 corresponds to 0.2 W/m² erythemally effective.
Do not confuse with: The UV index applies to the sun outdoors. It is not applicable to artificial UV sources at the workplace – the exposure limits of the German OStrV apply there.
Governed by: ISO/CIE 17166 · DIN EN 14255-1
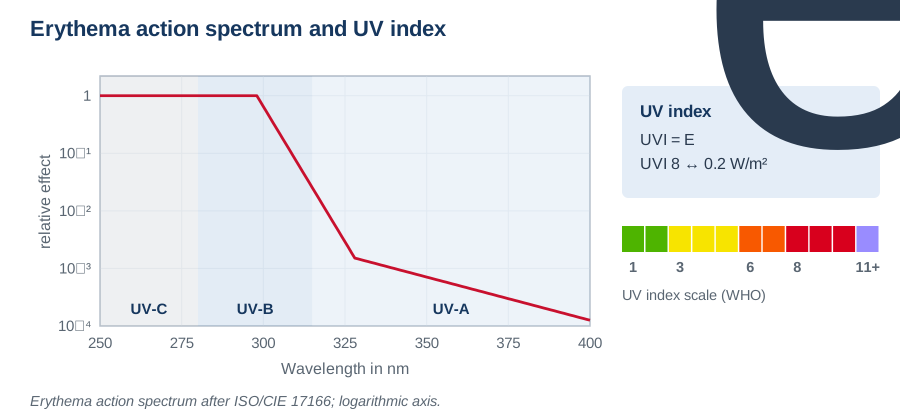
The erythema action spectrum drops by three to four orders of magnitude from UV-B to UV-A. The UV index follows from the erythemally weighted irradiance.
Germicidally effective exposure (Hgerm) in J/m²
Germicidally effective exposure is the dose weighted with the germicidal action spectrum, whose maximum lies close to the DNA absorption peak at around 260 nm. The DVGW code W 294 and DIN 19294 require at least 400 J/m² (40 mJ/cm²) as fluence for drinking water disinfection, demonstrated biodosimetrically.
Do not confuse with: With UV-C LEDs at 265 or 275 nm the weighting is decisive: a measurement calibrated at 254 nm reads too low for a 275 nm LED if the spectral mismatch is not accounted for.
Governed by: DVGW W 294 · DIN 19294 · ÖNORM M 5873
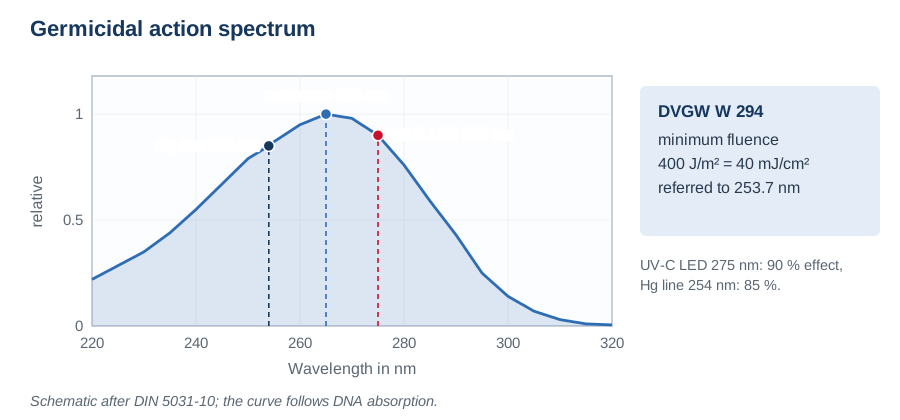
The germicidal effect follows DNA absorption with its maximum at 265 nm. The Hg line at 254 nm and a UV-C LED at 275 nm both lie close to the maximum.
Blue-light weighted radiance (LB) in W/(m²·sr)
LB weights the spectral radiance with the function B(λ), which peaks between 400 and 500 nm, and thus assesses the photochemical retinal hazard. From LB and the permissible exposure duration follows the classification of a lamp into the exempt group or risk groups 1 to 3.
Do not confuse with: For small sources and short viewing times the blue-light weighted irradiance EB is used instead of radiance. Which quantity applies depends on the angular subtense of the source.
Governed by: IEC 62471 · DIN EN 62471
Actinic UV hazard (ES) in W/m²
The actinic UV hazard weights irradiance with the function S(λ) of IEC 62471 and ICNIRP, which combines photokeratitis and skin reddening. It is the quantity against which the exposure limit of 30 J/m² per working day is checked, and the usual starting point of every risk assessment on UV equipment.
Do not confuse with: The actinic assessment covers UV-A only partly. A separate, unweighted limit applies to UV-A in addition.
Governed by: IEC 62471 · ICNIRP · TROS IOS
UV-A irradiance (EUVA) in W/m²
EUVA is the irradiance integrated unweighted over the 315 to 400 nm range. The exposure limit is 10,000 J/m² per working day for the eye; at 10 W/m² this gives a permissible duration of about 17 minutes. In fluorescent and penetrant inspection this value is the limiting one, not the actinic assessment.
Do not confuse with: The range limits differ by standard: DIN 5031-7 and CIE put UV-A at 315 to 400 nm, DIN/ISO 20473 at 315 to 380 nm, US sources from 320 nm. When comparing readings, the limit used belongs with them.
Governed by: TROS IOS · ICNIRP · DIN/ISO 20473
Exposure limit value (Heff) in J/m²
The exposure limit value caps the exposure of employees over an eight-hour working day. For incoherent UV radiation Heff = 30 J/m² actinically weighted applies, plus 10,000 J/m² for UV-A. From the measured Eeff follows the permissible dwell time t = Heff/Eeff – at 1 W/m² actinic that is 30 seconds.
Do not confuse with: The limit is not a target but an upper bound. It applies to the daily sum of all exposures, not to a single event.
Governed by: OStrV · TROS IOS · RL 2006/25/EG · ICNIRP
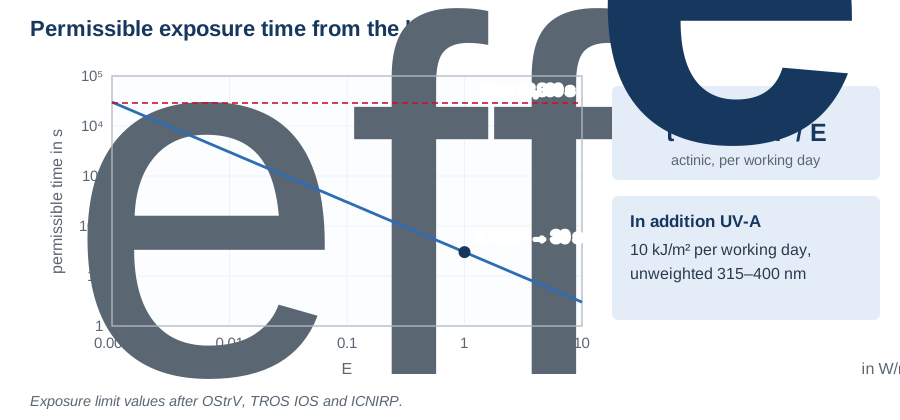
The limit of 30 J/m² (actinically weighted) divided by the effective irradiance gives the permissible exposure time per working day.
Curing dose (HUV) in mJ/cm²
The curing dose is the radiant exposure required for complete cross-linking, referred to the absorption range of the photoinitiator used. Typical figures lie between 200 and 2000 mJ/cm². Because photoinitiators absorb in narrow bands, the wavelength range of the measurement always belongs with the dose figure.
Do not confuse with: A dose figure without a band is worthless: 500 mJ/cm² UV-A and 500 mJ/cm² UV-C describe entirely different processes. Belt radiometers therefore measure in separate channels.
Governed by: DIN EN 13523-25
What is lost on the way from the source to the target: transmission, reflection, absorption.
| Quantity | Symbol | Unit |
|---|---|---|
| Transmittance | τ | —, % |
| Reflectance | ρ | —, % |
| Absorptance | α | —, % |
| Optical density | OD | —, A (Extinktion) |
| Absorption coefficient | a | 1/m, 1/cm |
| Spectral absorption coefficient at 254 nm | SAK254 | 1/m, UVT in % |
Transmittance (τ)
Transmittance is the ratio of transmitted to incident radiant power, τ = Φt/Φ0. It depends on wavelength: fused silica transmits UV-C, borosilicate glass barely, ordinary window glass not at all. For a UV process the transmittance of the protective tube or window directly determines the irradiance at the point of action.
Do not confuse with: The measured transmittance includes the reflection losses at both surfaces. The pure material share – the internal transmittance – is higher.
Governed by: DIN 5036-3 · DIN EN 410
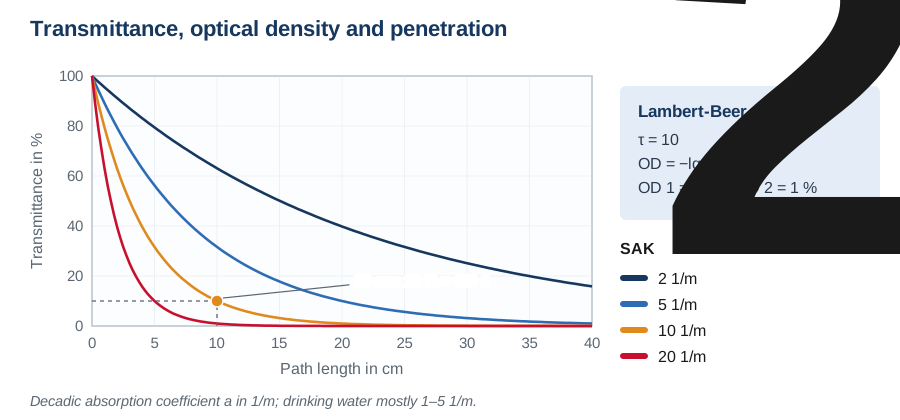
According to Lambert-Beer, transmittance falls exponentially with path length. Each unit of optical density reduces it to a tenth.
Reflectance (ρ)
Reflectance is the ratio of reflected to incident radiant power. In the UV, materials differ widely: PTFE and barium sulphate reach over 95 % diffuse reflectance down below 250 nm, anodised aluminium considerably less, ordinary white paints collapse in the UV. In irradiation chambers reflection contributes substantially to the irradiance.
Do not confuse with: Specular and diffuse reflection must be distinguished: a mirror throws radiation back directionally, a PTFE surface evenly into the hemisphere. Only diffuse reflection is usable for integrating spheres.
Governed by: DIN 5036-3 · CIE 130
Absorptance (α)
Absorptance is the ratio of absorbed to incident radiant power. Together with transmission and reflection the energy balance τ + ρ + α = 1 holds. Absorbed radiation is the only radiation that can have a photochemical effect – what is transmitted or reflected does nothing.
Do not confuse with: Absorptance is dimensionless and referred to the incident power; the absorption coefficient, by contrast, describes how fast radiation decays in the material and has the unit 1/m.
Governed by: DIN 5036-3
Optical density (OD)
Optical density is the negative decadic logarithm of transmittance: OD = −log₁₀τ. OD 1 lets 10 % through, OD 2 one per cent, OD 3 one per mille. Because the optical densities of filters in series add up, it is the practical quantity for filter stacks and protective eyewear.
Do not confuse with: In analytics the same quantity is called extinction or absorbance A. For protective eyewear the protection level is given per wavelength range – a single OD figure is not enough there.
Governed by: DIN EN 170 · DIN 5036-3
Absorption coefficient (a) in 1/m
By the Lambert-Beer law, irradiance decays exponentially in a homogeneous medium: E(d) = E₀·e−a·d. The absorption coefficient a is the material-specific decay constant per path length. In water treatment the penetration depth follows from it: at a = 10 1/m only a third of the radiation is left after 10 cm.
Do not confuse with: There is a natural (base e) and a decadic (base 10) form; they differ by the factor ln 10 = 2.303. When taking over values, the base must be checked.
Governed by: DIN 38404-3
Spectral absorption coefficient at 254 nm (SAK254) in 1/m
SAK₂₅₄ is the decadic absorption coefficient of water at 254 nm, measured according to DIN 38404-3. Drinking water typically lies at 1 to 5 1/m, waste water considerably higher. It is often quoted as UV transmittance over a 1 cm path: SAK 5 1/m corresponds to about 89 % UVT.
Do not confuse with: SAK₂₅₄ describes absorption, not turbidity. Particles scatter in addition and can shield micro-organisms without changing SAK much.
Governed by: DIN 38404-3 · DVGW W 294
Solid angle, inverse-square law, cosine error, uncertainty – why two instruments show different values.
| Quantity | Symbol | Unit |
|---|---|---|
| Solid angle | Ω | sr, Steradiant |
| Inverse-square law | E ~ 1/r² | — |
| Cosine error | f₂ | % |
| Spectral mismatch | f₁′ | % |
| Linearity | f₃ | % |
| Measuring field angle | α | ° |
| Spectral resolution | ΔλFWHM | nm |
| Measurement uncertainty | U | % |
| Metrological traceability | — | — |
Solid angle (Ω) in sr
Solid angle is the quotient of the area a cone cuts out of a sphere's surface and the square of the sphere's radius: Ω = A/r². The full sphere has 4π ≈ 12.57 sr, the hemisphere 2π sr. A 10 degree beam angle corresponds to about 0.024 sr.
Do not confuse with: Half beam angle and full beam angle are often mixed up. Converting to steradian, that leads to a factor of four.
Governed by: ISO 80000-3
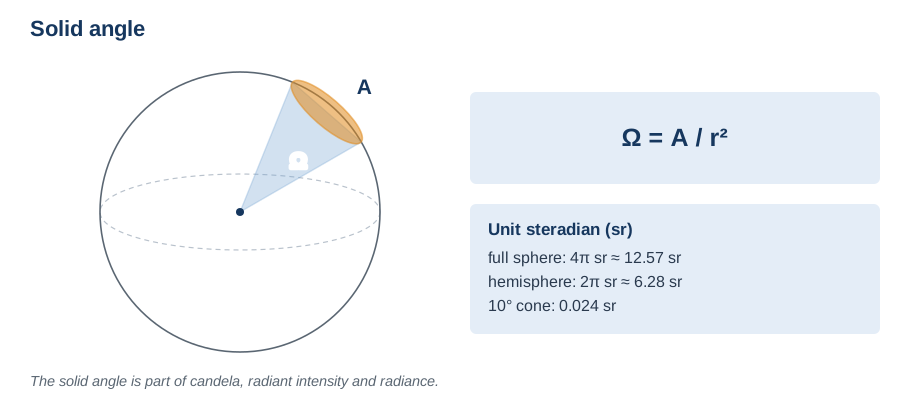
The solid angle is the cut-out sphere area divided by the square of the radius. The full sphere has 4π sr.
Inverse-square law (E ~ 1/r²)
For a point source E = I/r²: irradiance decreases with the square of the distance, because the same power spreads over an area growing quadratically. The law is the basis of every distance conversion in system design.
Do not confuse with: It applies only beyond the photometric limiting distance. Under an LED array, a tubular lamp or inside an irradiation chamber it leads to gross errors – only a simulation or a measurement helps there.
Governed by: DIN 5032-1
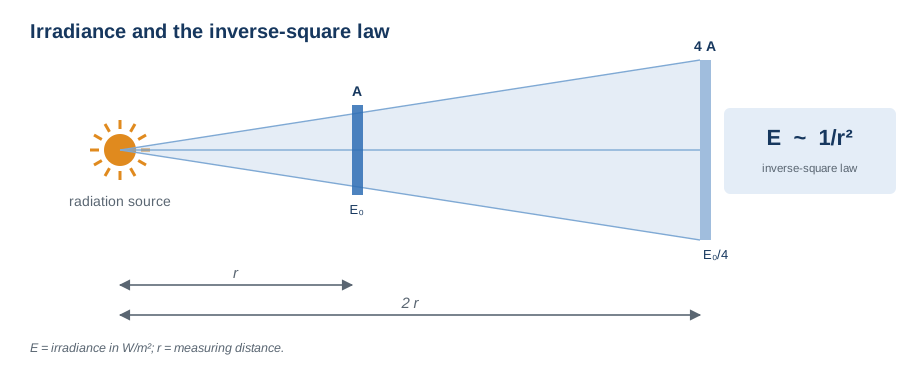
The inverse-square law applies only beyond the limiting distance, where the source can be treated as a point.
Cosine error (f₂) in %
An ideal irradiance receiver weights radiation incident at angle ε with cos ε. The figure f₂ describes the deviation from that. Under DIN 5032-7, f₂ may be at most 1.5 % in class L and 3 % in class A. With diffuse irradiation or large-area sources a poor cosine response feeds straight through into the reading.
Do not confuse with: At normal incidence from a large distance the cosine error hardly shows. That is precisely why laboratory and plant measurements often disagree.
Governed by: DIN 5032-7 · DIN EN 13032-1

An ideal receptor weights obliquely incident radiation with cos θ. The deviation from it is the cosine error.
Spectral mismatch (f₁′) in %
f₁′ measures the deviation of an instrument's relative spectral responsivity from the target curve, for example V(λ) for lux meters or an action spectrum for UV radiometers. A sensor with a small f₁′ reads correctly even for unfamiliar spectra; with a large f₁′ the calibration factor holds only for the source it was calibrated against.
Do not confuse with: That is why the question "which lamp was it calibrated against?" is the decisive one for every broadband radiometer. Anyone changing source technology – from mercury vapour to UV LED, say – needs a new calibration or a spectroradiometer.
Governed by: DIN 5032-7 · CIE 220

If the spectrum of the measured lamp differs from the calibration spectrum, a radiometer reads wrong – the more so, the less its responsivity follows the target curve.
Linearity (f₃) in %
The figure f₃ describes the deviation from a linear relationship between irradiance and reading. It is checked at several points of the measuring range. At high irradiances, as they occur under UV LED arrays or in curing systems, it is the limiting property – sensors saturate there.
Do not confuse with: An instrument that reads correctly at 10 mW/cm² can be off by per cent at 2 W/cm². The measuring range therefore belongs to the choice of sensor and to the calibration certificate.
Governed by: DIN 5032-7
Measuring field angle (α) in °
The measuring field angle defines which part of the source a radiance or luminance meter captures. Common values are one degree or one fifth of a degree. In assessments under IEC 62471 it is prescribed, because the risk group depends on the angle over which the average is taken.
Do not confuse with: If the measuring field is larger than the source, dark background is averaged in and radiance reads too low. If it is smaller, a local peak is measured.
Governed by: IEC 62471 · DIN 5032-7
Spectral resolution (ΔλFWHM) in nm
Spectral resolution is the full width at half maximum of the instrument function, i.e. the width to which the instrument broadens an infinitely narrow line. It is set by slit width, grating and detector pixels. To assess line emitters such as mercury vapour lamps it must be considerably smaller than the line spacing.
Do not confuse with: The step width of the data points is not the resolution. An instrument can output in 0.5 nm steps and still resolve only 5 nm.
Governed by: CIE 214 · DIN 5032-1

Slit width, grating and detector determine the spectral resolution of a spectroradiometer.
Measurement uncertainty (U) in %
The expanded measurement uncertainty U is computed from the individual contributions according to the GUM and stated with a coverage factor k = 2, corresponding to roughly 95 % coverage probability. In UV radiometry, accredited calibrations typically lie between two and six per cent depending on wavelength and quantity; the uncertainty of a measurement in the plant is regularly larger.
Do not confuse with: The uncertainty on the calibration certificate applies to laboratory conditions. In the process, cosine error, spectral mismatch, contamination and temperature come on top.
Governed by: GUM / JCGM 100 · DIN EN ISO/IEC 17025
Metrological traceability
Traceability means that a measurement result is related to a national or international standard through a documented, unbroken chain of comparisons, each with a stated uncertainty – in Germany to the PTB. An accredited calibration laboratory under DIN EN ISO/IEC 17025 demonstrates this chain with the ISO 17025 calibration certificate.
Do not confuse with: A works certificate is not a traceable calibration. For process releases, audits and risk assessments the accredited certificate is usually required.
Governed by: DIN EN ISO/IEC 17025 · VIM / JCGM 200
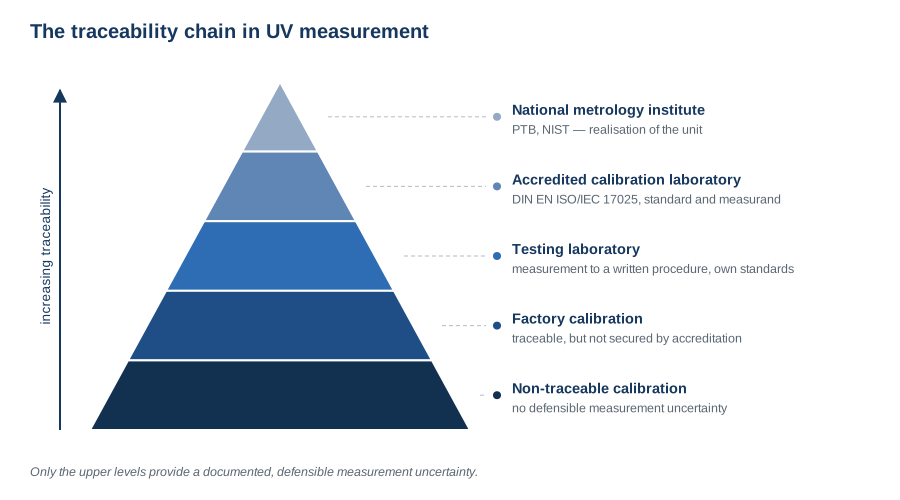
A measurement is traceable when an unbroken chain of calibrations with stated uncertainty leads to the national standard.
Frequently asked questions about optical quantities
Radiometric quantities assess radiation energetically, across the whole spectral range and independently of the eye. Photometric quantities are the same quantities weighted with the luminous efficiency function V(λ) — and therefore defined only in the visible range from 380 to 780 nm. A UV source thus has zero lumen, however much power it emits. Lux can be converted to W/m² only when the spectrum is known.
Ra is the average over eight weakly saturated test colours after CIE 13.3:1995. An LED can reach Ra 85 and still render saturated red dull — only the special index R9 shows that. IES TM-30-15 instead rests on 99 colour samples and separates fidelity (Rf) from gamut (Rg); for narrow-band LED spectra that is the more informative assessment.
A broadband radiometer is enough as long as the source is known and spectrally stable and the sensor was calibrated against that very source. As soon as source technologies are compared, the spectrum shifts through ageing, an action spectrum has to be applied or a chromaticity determined, there is no way around the spectral distribution S(λ). The underlying error is called spectral mismatch.
As a rule the dose, i.e. the radiant exposure H in J/m² or mJ/cm², measured in the wavelength range of the effect. Irradiance E only determines how fast the dose is reached. Both values belong separately in the documentation, because an ageing lamp delivers a lower dose after the same time.