


Measuring and monitoring UVC radiation at 254 nm
The 253.7 nm line of low-pressure mercury lamps is a central radiation source in UV water and air disinfection. Reference measurement, plant monitoring and dose assessment each call for different sensor concepts. What matters are spectral matching, measurement geometry, long-term stability and a calibration that matches the real source.
This page separates the three measurement tasks and shows which errors arise when sensor and source do not match.
Why the wavelength 253.7 nm
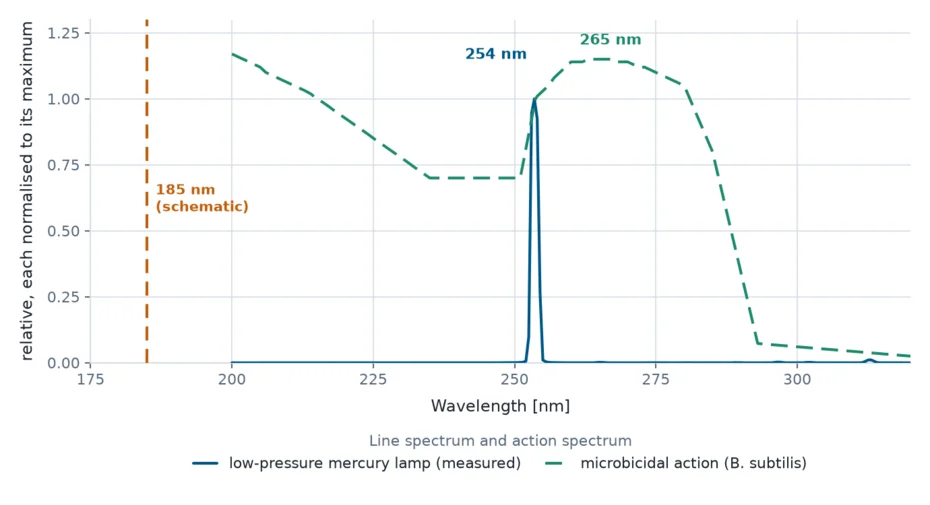
The germicidal effect of UV radiation depends on wavelength. It essentially follows the absorption of nucleic acids and reaches its maximum in the region around 265 nm. The main emission line of the low-pressure mercury lamp lies at 253.7 nm and therefore close by: it captures a large part of the effect without sitting exactly at the maximum.
Wavelength alone is not decisive, however. The effect results from wavelength, radiant exposure – irradiance times time – and the sensitivity of the particular micro-organism. That 254 nm has become the technical standard is therefore just as much a practical matter: the source works with high efficiency, its spectrum is narrow and thus unambiguous to evaluate metrologically, transmission in air and water is sufficient over practically relevant paths, and the normative basis has grown over decades.
The figure below shows the measured spectrum of a low-pressure mercury lamp from the Opsytec spectral database together with a microbicidal action spectrum for spores of Bacillus subtilis (Cabaj et al. 2002, normalised at 253.7 nm). The 185 nm resonance line is drawn schematically because it lies outside the measured range.
How the 254 nm line is produced
The low-pressure mercury lamp is a gas discharge in a quartz tube containing a droplet of mercury and a starting gas, usually argon. The mercury vapour pressure is a few pascal, the total internal pressure up to about 10 mbar. The discharge is strongly non-thermal: the electrons reach a few electronvolts while the gas stays almost cold. It is precisely this imbalance that makes the supplied power go mainly into excitation rather than into heat.
Electron collisions raise mercury atoms into the resonance levels; their decay to the ground state yields the two resonance lines. At 253.7 nm lies the main emission line and thus the germicidally used share. The second line at 185 nm leaves the lamp only if the envelope material transmits it; in air it generates ozone and is, depending on the application, either used deliberately for oxidation processes or suppressed by doped quartz glass (overview of the mercury vapour lamp, in German).
Because both lines are resonant, the photons are repeatedly absorbed and re-emitted inside the plasma. This radiation trapping ties the efficiency directly to the mercury vapour pressure and hence to the wall temperature: the optimum of the coldest wall spot lies around 40 °C, and above and below it the 254 nm output falls off. In a plant, medium temperature and flow therefore act directly on the emitted radiant power. Amalgam lamps shift this optimum to higher temperatures and allow considerably higher power densities.
Over the service life the position of the line stays stable while the radiant power decreases. For measurement this is the favourable case: the spectral weighting of the sensor remains valid and only the amplitude drops. With medium-pressure lamps and UVC LEDs the spectral distribution changes as well – which is where the mismatch described further down comes from.
From observation to a standardised procedure
The effect came before the technology. In 1877 Downes and Blunt showed that sunlight inhibits bacterial growth; in 1903 Niels Ryberg Finsen received the Nobel Prize for light therapy. The matching source emerged in parallel: Leo Arons is regarded as the inventor of the mercury vapour lamp on the basis of work from 1892, the quartz glass sun lamp followed from 1905, and between 1923 and 1934 mercury discharge lamps were commercialised as low-, medium- and high-pressure versions (overview of the mercury vapour lamp, in German). The first UV plant for drinking water disinfection went into operation in Marseille as early as 1910.
Only later did the effect become measurable and comparable. In 1930 R. L. Gates published the first systematic study of the bactericidal effect and thereby introduced the germicidal action spectrum. From the 1980s onwards came the normative anchoring in drinking water treatment; in Germany the DVGW code of practice W 294 and DIN 19294 shape testing, plant sensors and reference measurement today.
The development thus took three steps: biological observation in the 19th century, a controllable source in the first half of the 20th century, and metrological and normative assurance in its second half. Only the third step turns an effect into a monitorable procedure.
Where 254 nm is used
The largest field of application is the disinfection of drinking, process and waste water in flow-through reactors, in Germany with plant sensors and reference measurement to DVGW W 294 and DIN 19294-3. Alongside this come the disinfection of air and surfaces in clinics and in food and pharmaceutical production, in ventilation ducts and cleanrooms, as well as the treatment of packaging, conveyors and filling lines in the beverage and food industry.
If the 185 nm line is released, the photochemical effect is added: UV oxidation and TOC reduction work with the ozone formed in the beam path and the radicals arising from it. An even shorter-wave, purely photochemical alternative is described on the page measuring 172 nm VUV radiation from xenon excimer lamps. In the laboratory, 254 nm radiation finally serves as a defined reference, for instance for dose-response studies in a collimated beam setup. Effect, procedures and standards are placed in context on the application page UV disinfection.
In every case the same relationship holds: what counts is the radiant exposure actually effective in the medium, not the nominal power of the lamp. Irradiance, residence time, flow and transmission determine the result together – which is why measurement is part of the procedure and not an accessory to it.
Three measurement tasks, three sets of requirements
- Reference measurement. A traceably calibrated reference radiometer determines the irradiance at a defined position, for example to check a plant sensor. Here low measurement uncertainty and a defined geometry are what count.
- Plant monitoring. A permanently installed sensor monitors the source continuously and supplies a signal to the control system. Here long-term stability, resistance to the medium and to cleaning, and a suitable interface are what count.
- Dose or fluence assessment. The radiant exposure related to the medium is not measured directly but derived from irradiance, residence time, flow and the transmittance of the medium, or determined biodosimetrically.
These three tasks are defined separately. A plant sensor does not replace a reference measurement, and a reference measurement does not replace a dose assessment.
Spectral matching and typical mismatch
A sensor designed for 254 nm is matched to the narrow line spectrum of the low-pressure lamp. If the same sensor is used on a medium-pressure lamp or a UVC LED, it evaluates a different spectrum with a responsivity curve not intended for it. The result is a systematic deviation that can only be remedied with a source-specific correction factor.
The spectrum also changes over lifetime within one type of source. With low-pressure lamps the line position stays stable while the output falls; with medium-pressure lamps and LEDs the spectral distribution changes as well. Anyone comparing or switching source types therefore needs a spectrally resolved reference.
Measurement geometry in reactors and chambers
In flow-through reactors a sensor measures at a defined mounting position through a sensor window. What is measured is not the radiant exposure acting on the medium, but a signal linked to it through the plant design. Window fouling, ageing of the source and the transmittance of the medium affect this signal differently – which is why sensor position, calibration and evaluation rule have to be defined together.
In the laboratory, collimated beam setups allow defined, almost parallel irradiation of a sample and therefore a reliable dose–response relationship. Transfer to the reactor is made through validation, not through a single reading. The procedure is described on the page UV reactor validation.
Suitable measuring equipment
- UVC meter – all UVC meters and sensors compared.
- DVGW reference radiometer – reference measurement on drinking water plants to DIN 19294-3.
- UVC-SE and UVx-SE – pressure-tight sensors for permanent plant monitoring.
- RMD Pro with a UVC sensor – handheld measurement on lamps, chambers and surfaces.
- SR900 – spectrally resolved reference where source types are compared or the spectrum is unknown.
All measurement chains are calibrated traceably in the accredited calibration laboratory. The application page UV disinfection places the measurement in the context of effect, process and standards.
Author: Dr. Mark Paravia
Dr.-Ing. Mark Paravia is the managing director of Opsytec Dr. Gröbel GmbH in Ettlingen and heads the accredited calibration laboratory. Following his research on pulsed xenon excimer discharges at the Institute of Lighting Technology at KIT, his focus today is optical radiation measurement. He is vice-chair of the DIN standards committee FNL 7 “Optical radiation” and a member of the DVGW project group on UV disinfection.