


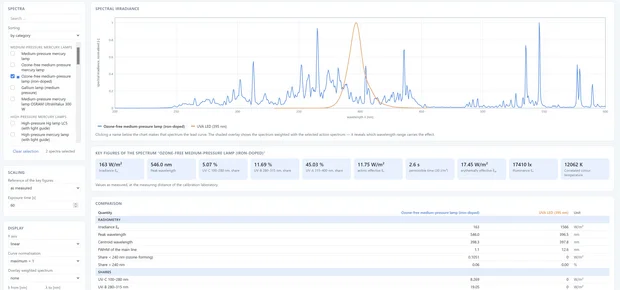
The UV Spectra Database Explorer evaluates the 66 measured and calculated spectra of the Opsytec spectral database: select UV lamps and UV LEDs, overlay them in the chart and compute every radiometric, photometric and photobiological quantity in one go. These include irradiance Ee, the shares in UV-C, UV-B, UV-A2, UV-A1, in the visible range and in the IR according to CIE, peak and centroid wavelength, FWHM, the ozone-forming share below 240 nm, illuminance, chromaticity coordinates, correlated colour temperature and colour rendering index Ra, as well as the weighted quantities for actinic UV hazard, blue light hazard, microbicidal effect on B. subtilis spores and on MS2, erythema, vitamin D synthesis and melanopic effect – each with the permissible exposure time and with the dose for a freely chosen exposure duration.
Every spectrum can be scaled to a target value, for example 10 W/m² in the UV-A, so that lamp types can be compared at the same irradiance. Own measurements as .spec, .isd, CSV, TXT or XLSX can be added and evaluated with the same formulas; they are processed exclusively in the browser memory and are never stored.
The results can be exported as a CSV table or as a PDF report. The calculated values are for orientation – only a measurement with a calibrated spectroradiometer is binding, such as those Opsytec Dr. Gröbel builds and calibrates in its own calibration laboratory.
Fundamentals of spectral evaluation
Every selected spectrum yields the same set of quantities — for database spectra and for your own measurements alike:
- Radiometry: irradiance Ee in W/m², peak wavelength, centroid wavelength, FWHM of the main line and the ozone-forming share below 240 nm.
- Shares: UV-C, UV-B, UV-A2, UV-A1, UV-A, visible range and IR — each as irradiance and as a percentage of the total radiation.
- Photometry and colour: illuminance Ev, luminous efficacy of radiation K in lm/W, chromaticity x and y, u′ and v′ per CIE 1976, correlated colour temperature and colour rendering index Ra.
- Photobiological safety: actinic effective irradiance Es with the permissible exposure time up to 30 J/m², the UV-A time up to 10 000 J/m² and the blue light hazard EB with the time up to 100 J/m².
- Action spectra: microbicidally effective irradiance, efficiency and dose — separately for Bacillus subtilis (sbakt) and for the enterobacteriophage MS2 (sMS2) —, plus erythemally and vitamin D effective irradiance as well as the melanopic effect with mel-EDI and mel-DER.
- Dose: radiant exposure He and all weighted doses for the exposure duration set.
The values appear as tiles for the lead curve and as a comparison table across all selected spectra; both can be exported as a CSV file or as a PDF report.
All integrals are formed with the trapezoidal rule on the native measurement grid of the spectrum. The action spectra are interpolated linearly onto that grid and set to zero outside their domain; the spectrum itself is never resampled. If the measured range does not fully cover the domain of an action spectrum, the Explorer flags the affected quantity.
The band limits follow the CIE definition: UV-C 100–280 nm, UV-B 280–315 nm, UV-A2 315–340 nm, UV-A1 340–400 nm, UV-A 315–400 nm, visible 380–780 nm, IR above 780 nm. Photometric and colorimetric quantities come from V(λ) per CIE 1924 / ISO 23539 and the CIE 1931 (2°) colour matching functions: Ev = 683 lm/W · ∫ E(λ) · V(λ) dλ. The correlated colour temperature follows from the smallest distance to the Planckian locus in the CIE 1960 uv plane and stays empty when the chromaticity lies too far from it — which is the rule for excimer lamps and narrow-band LEDs. The colour rendering index Ra follows CIE 13.3-1995 with eight test colour samples, von Kries adaptation and U*V*W*.
The photobiological quantities use S(λ) per ICNIRP / EN 14255-1 / EN 62471 (actinic, limit 30 J/m²), the UV-A limit of 10 000 J/m², B(λ) per EN 62471 (blue light, 100 J/m²), the erythema action spectrum per ISO 17166 / CIE S 007, the vitamin D action spectrum per CIE 174:2006, the melanopic action spectrum per CIE S 026:2018 and two separate microbicidal action spectra: sbakt(λ) for Bacillus subtilis per Cabaj et al. 2002 (Water Supply 2(3), 175–181, 200–400 nm) and sMS2(λ) for the enterobacteriophage MS2 per Beck et al. 2015 (Water Research 70, 27–37, 200–300 nm) — both normalised to 253.7 nm, but not interchangeable. Which function is stored with which source and domain is shown by the “Calculation basis” card in the app. Opsytec explains the underlying quantities under radiometric quantities and photometric quantities.
Besides the database spectra, your own measurements can be loaded and evaluated with the same formulas: .spec from the Opsytec SRpro software, .isd from SpecWin, and tables as .csv, .txt, .dat or .xlsx. For tables the Explorer detects the separator, the decimal mark, the wavelength column, the value columns and the unit on its own; if a file holds several value columns, each column becomes its own spectrum. Recognised units range from W/(m²·nm) through mW/cm²/nm to µW/cm²/nm, including the notation W m-2 nm-1.
Files are processed exclusively in the browser memory: nothing is transferred, nothing is stored, and reloading the page discards the measurements. Loaded spectra sit alongside the database spectra in the chart, in the comparison table and in the PDF report.
The database spectra were recorded at the measuring distance of the calibration laboratory; their absolute values therefore depend on distance and sample. To compare lamp types, every spectrum can be scaled to a target value — for example 10 W/m² in the UV-A or 1 mW/cm² in total. The Explorer then converts all values proportionally: shares and colour values stay unchanged, while irradiances, doses and permissible exposure times follow the target value.
The exposure duration set yields the radiant exposure He = Ee · t and the weighted doses. Conversely, the permissible exposure time shows after which time the respective limit would be reached. These values are guidance for the design; assessing a workplace calls for a measurement per EN 14255-1 — with a radiometric UV sensor or a spectroradiometer. For UV disinfection systems, Opsytec summarises the requirements under safety of UV disinfection.
The database holds 66 spectra: 55 lamps and LEDs from 15 classes plus 11 reference spectra.
- Low-pressure mercury lamps emit almost monochromatically at 254 nm — the classic of UV disinfection; ozone-forming versions additionally carry the 185 nm line.
- Medium- and high-pressure mercury lamps deliver a line spectrum across the whole UV range and are used for UV curing; doping with iron or gallium shifts the power into the UV-A.
- Excimer lamps emit narrow-band at 172 nm (surface activation, ozone generation) or at 222 nm (far UV-C).
- UV LEDs come as UV-A types around 365–405 nm for curing and fluorescence inspection, as UV-B types and as UV-C types around 265–285 nm for disinfection; their FWHM is typically 10–15 nm.
- Visible-range LEDs — blue, green, red and white sources reproducing the standard illuminants A, D50 and E — are measured across the whole visible range and therefore also yield chromaticity coordinates, colour temperature and colour rendering index.
- Infrared LEDs emit narrow-band around 750–950 nm — beyond the limit of visibility — and are used in sensing, night vision and spectroscopy; their spectra are measured up to 1045 nm.
- UV fluorescent lamps cover broad UV-A or UV-B bands, for weathering, phototherapy or insect traps.
- Xenon and metal halide lamps come close to the solar spectrum and serve solar simulation and weathering tests.
- Halogen and deuterium lamps are used as reference sources: halogen in the visible and near infrared, deuterium in the UV.
- Reference spectra — the measured sun, the AM reference spectra per ASTM G173-03 and the standard illuminants per CIE 15 — serve as a benchmark when a lamp is meant to reproduce daylight or a standard illuminant. They do not come from the Opsytec calibration laboratory; every entry states its origin. Alongside them sits the narrow-band 365 nm reference condition per DIN EN ISO 3059 — the irradiance to which UV-A meters for penetrant and magnetic particle testing are referred; it was measured in our calibration laboratory.
Several selected spectra are overlaid in the chart — with “peak = 1” to compare the shape, or scaled to a common target value for the energetic comparison. The raw data of all spectra can be downloaded from the spectral database for UV lamps and UV LEDs.
Eleven entries are marked as such and do not come from the calibration laboratory; where a source yields no irradiance — the 172 nm excimer lamp and the standard illuminants — the curve is normalised to 1 W/m², which leaves shape and shares untouched. The other spectra are typical samples of their lamp class, measured in the calibration laboratory of Opsytec Dr. Gröbel GmbH according to CIE 250:2022. Sample spread, ageing, operating temperature, ballast and measuring distance change the absolute irradiance and — to a lesser extent — the spectral distribution. The calculated values are for orientation, not for acceptance testing.
In detail: quantities whose action spectrum reaches beyond the measured range are flagged; the colour temperature is omitted for chromaticities far from the Planckian locus, and Ra is marked as not applicable once |Duv| exceeds 0.0054. Binding values come only from a measurement with a traceably calibrated instrument — such as the SR900 spectroradiometer or the RM-12 UV meter, calibrated in the UV laboratory of Opsytec.
Frequently asked questions about evaluating UV spectra
The dose is the product of irradiance and time: H = E · t. The Explorer integrates the irradiance in the desired band from the spectrum; the exposure duration is set on the left. For weighted quantities — actinic, erythemal, vitamin D — the spectrum is first weighted with the action spectrum, then integrated and only afterwards multiplied by the time.
It states after which time the respective limit would be reached: 30 J/m² for the actinic effective exposure per EN 14255-1, 10 000 J/m² for unweighted UV-A and 100 J/m² for the blue light hazard per EN 62471. The figure applies to the selected spectrum at the displayed irradiance and does not replace a risk assessment.
Yes. The Explorer reads .spec, .isd, CSV, TXT and XLSX files directly in the browser; the file never leaves your computer and is not stored. Reloading the page discards it.
The correlated colour temperature is only meaningful when the chromaticity lies close enough to the Planckian locus. For UV sources, excimer lamps and narrow-band LEDs it does not — the Explorer then shows N/A instead of a meaningless number. For the same reason the colour rendering index is marked as not applicable once the distance to the locus becomes too large.
They are absolute in W/(m²·nm), measured at the measuring distance of the calibration laboratory. Because that distance does not suit every application, each spectrum can be scaled to a target value; the spectral shape stays unchanged.
Because they describe different test organisms and therefore give different results. sbakt(λ) stands for spores of Bacillus subtilis, the test organism of biodosimetry; sMS2(λ) stands for the enterobacteriophage MS2, the surrogate used to validate medium-pressure systems. Both are normalised to 253.7 nm and agree there by definition — but not at other wavelengths: at 222 nm sMS2 is 2.09 while sbakt is 0.90. A 222 nm excimer source thus acts on MS2 more than twice as strongly as the same irradiance at 254 nm, but slightly less strongly on B. subtilis spores. The Explorer therefore reports both evaluations separately. Neither curve can be transferred to other organisms.
Author: Dr. Mark Paravia
Dr.-Ing. Mark Paravia is the managing director of Opsytec Dr. Gröbel GmbH in Ettlingen and heads the accredited calibration laboratory. Following his research on pulsed xenon excimer discharges at the Institute of Lighting Technology at KIT, his current focus is on optical radiation measurement technology. He is vice-chair of the DIN Standards Committee FNL 7 “Optical Radiation,” and a member of the DVGW Project Group on UV Disinfection.