


Colour in numbers
Colorimetric quantities with symbols and units
Colorimetric quantities describe what colour a light source has and how it renders colours. They all come out of a single measurement: the spectral distribution S(λ). From it follow the tristimulus values X, Y, Z, from those the chromaticity x, y or u′, v′, from those the correlated colour temperature Tn – and from the comparison with a reference source the colour rendering indices Ra and Rf. The field is called colorimetry; the energetic counterparts are the radiometric and the eye-weighted ones the photometric quantities.
Every colorimetric quantity assesses the same spectrum with a different question. The colour matching functions x̄(λ), ȳ(λ) and z̄(λ) reproduce colour vision; weighted with them, a whole spectrum collapses into three numbers. Two physically different spectra can yield the same three numbers and therefore look alike – that is metamerism. It is the reason why chromaticity alone does not describe a light source: two lamps with identical chromaticity can render colours visibly differently.
Which standard observer was used belongs with every figure. The 2° observer of CIE 1931 describes small fields of view, the 10° observer of CIE 1964 large ones. For the same spectrum the two give different chromaticities – most clearly for narrow-band LED spectra. Chromaticities from different observers are not comparable.
The table below lists the colorimetric quantities with symbol and unit. In full – with definition, delimitation and the governing standard – they are in the glossary of optical quantities.
Colorimetric quantities at a glance
| Quantity | Symbol | Unit |
|---|---|---|
| Tristimulus values | X, Y, Z | — |
| Standard observer (2° and 10°) | CIE 1931 / CIE 1964 | — |
| Chromaticity coordinates | x, y | — |
| CIE 1960 UCS chromaticity | u, v | — |
| CIE 1976 UCS chromaticity | u′, v′ | — |
| CIELAB colour space | L*, a*, b* | — |
| DIN99 colour space (Lab99) | L99, a99, b99 | — |
| Colour difference | ΔE | — |
| Colour temperature and correlated colour temperature | T, Tn | K, CCT |
| Distance from the Planckian locus | Δuv | — |
| General colour rendering index | Ra | —, CRI |
| Special colour rendering indices | R1 bis R15 | — |
| Fidelity index of IES TM-30 | Rf | — |
| Gamut index of IES TM-30 | Rg | — |
| Saturation and chroma | S, C* | — |
| Hue angle | h | °, hab |
| Dominant wavelength | λd | nm |
| Colour purity | pe | % |
| MacAdam ellipse | SDCM | Stufen |
From the spectrum to the chromaticity
The tristimulus values X, Y, Z arise by weighting the spectral distribution with the three colour matching functions and integrating. Y is defined so that it corresponds to brightness: for a light source Y is proportional to illuminance. Every other colorimetric quantity is a conversion from these three numbers.
Chromaticity coordinates x, y – the chromaticity diagram
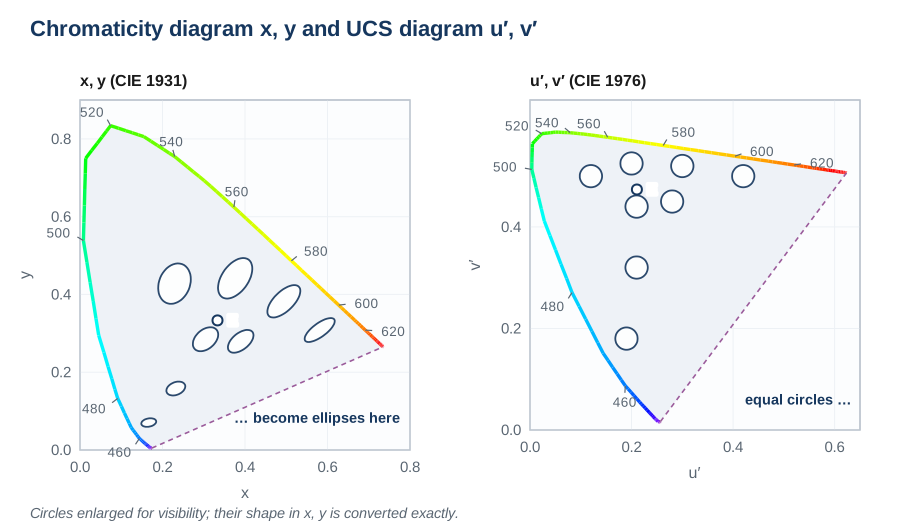
Normalising X, Y and Z to their sum leaves the chromaticity without the brightness: x = X/(X+Y+Z) and y = Y/(X+Y+Z). The pair is plotted in the horseshoe-shaped chromaticity diagram; white points lie around x = 0.33, y = 0.33. The diagram is vivid but not perceptually uniform: in the green region the same geometric distance means a far smaller perceived difference than in the blue.
u′, v′ – the uniform diagram
For distances between chromaticities the CIE 1976 UCS diagram is therefore used: u′ = 4X/(X+15Y+3Z) and v′ = 9Y/(X+15Y+3Z). There a distance Δu′v′ of 0.0054 roughly corresponds to the discrimination threshold everywhere. For the spread of LED batches and the tolerance of luminaires, Δu′v′ is the usual measure, alongside the step figure in MacAdam ellipses (SDCM).
Careful with u, v without the prime
The older CIE 1960 UCS diagram with u and v has not disappeared: correlated colour temperature and the distance Δuv from the Planckian locus are defined there to this day. u is identical in both diagrams, v is not – v′ = 1.5 · v. Mixing the two up gives a wrong colour temperature.
Colour temperature and the distance from the Planckian locus
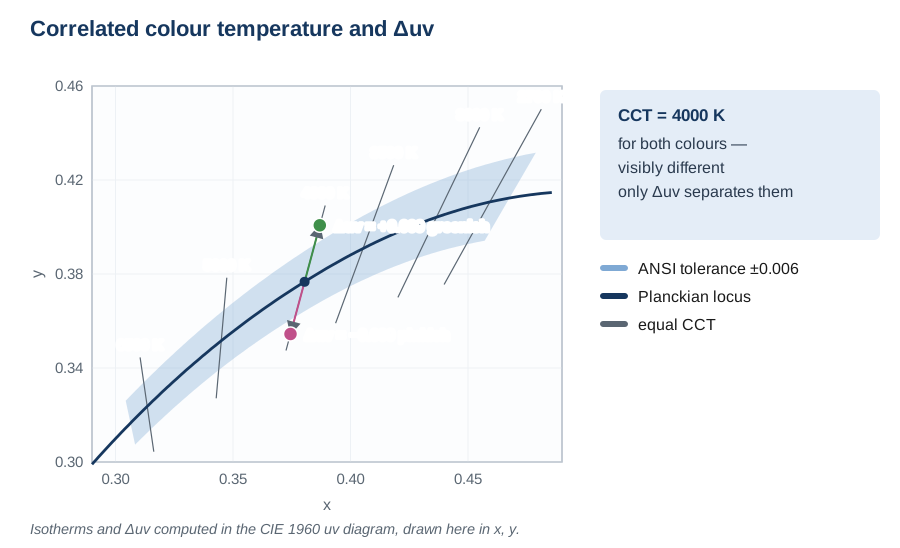
Colour temperature T is the temperature of a Planckian radiator whose chromaticity matches that of the source. For real lamps that is almost never exactly the case; what is quoted is therefore the correlated colour temperature Tn (CCT): the temperature of the Planckian radiator at the smallest distance in the CIE 1960 UCS diagram. Warm white lies at 2700 to 3000 K, neutral white at 4000 K, daylight white above 5300 K.
A colour temperature on its own is incomplete. Two lamps at 4000 K can look visibly different if their chromaticities sit at different distances from the Planckian locus. That distance is Δuv: positive values appear greenish, negative ones pinkish. ANSI C78.377 limits it to ±0.006 for white LED products. Beyond |Δuv| ≈ 0.005 a correlated colour temperature loses its meaning – the chromaticity is then no longer a white to which a temperature could sensibly be assigned.
Colour rendering: Ra, R9 and TM-30
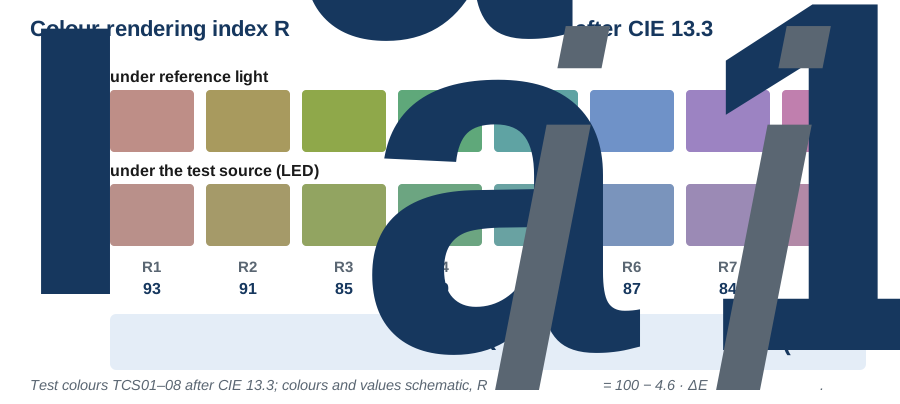
The general colour rendering index Ra of CIE 13.3:1995 compares the chromaticities of eight standardised test colours under the source under test with those under a reference source of the same colour temperature – a Planckian radiator below 5000 K, a daylight illuminant above. From the mean colour difference follows Ra = 100 − 4.6 · ΔE̅. Above 90 counts as very good, below 80 as inadequate for interiors.
Why R9 belongs in the specification
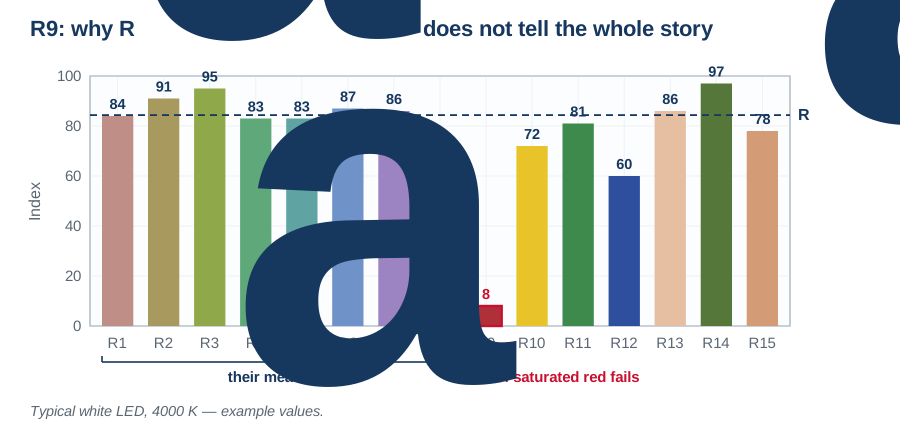
Ra averages over eight weakly saturated colours. Saturated red is not among them – that is what the special index R9 is for. White LEDs with a weak red component reach Ra 85 and drop below 20 for R9; meat, wood and skin then look dull. Anyone judging colours should explicitly ask for R9 as well as R13 and R15 for skin tones. The special indices R1 to R15 can become negative.
IES TM-30: Rf and Rg
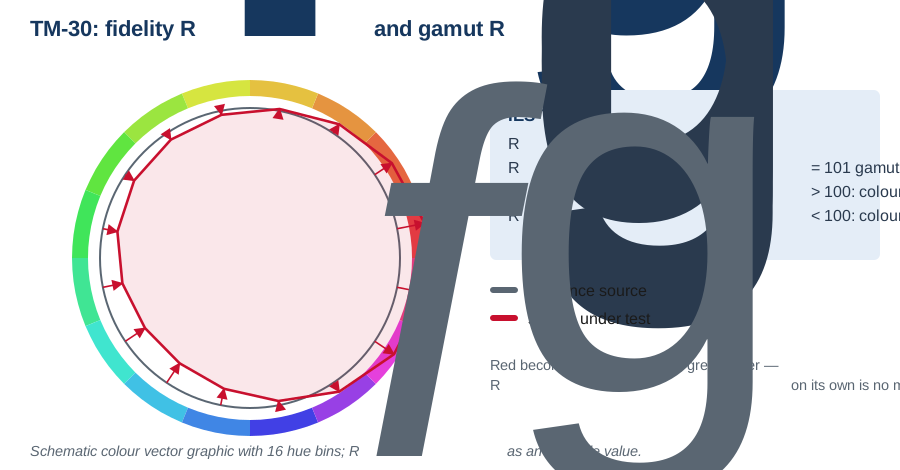
IES TM-30-15 supersedes the method by using 99 colour samples that cover real surfaces and the whole colour space evenly, and by computing in the uniform CAM02-UCS. The fidelity index Rf runs from 0 to 100. The gamut index Rg additionally says whether colours appear more saturated (above 100) or paler (below 100) than under the reference. Only both together with the colour vector graphic give a picture: a high Rg can come from oversaturated red that catches the eye but is not faithful. Rf and Ra cannot be converted into one another.
Dominant wavelength, saturation and hue angle
Besides chromaticity and colour rendering, a spectroradiometer outputs three quantities that describe the colour impression directly.
Dominant wavelength λd
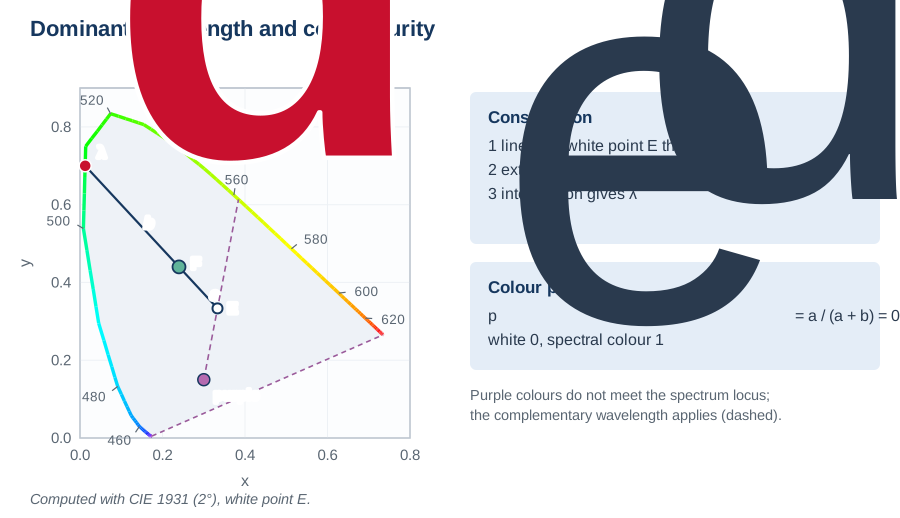
Draw a straight line from the white point through the chromaticity and extend it to the spectrum locus: the wavelength of the intersection is the dominant wavelength. It describes the perceived hue and is the decisive binning quantity for coloured LEDs. It is not the same as the peak wavelength λp, which comes from the physics of the spectrum: for an LED the two can differ by several nanometres. For purple colours there is no intersection; the complementary wavelength is given instead.
Saturation S and chroma C*
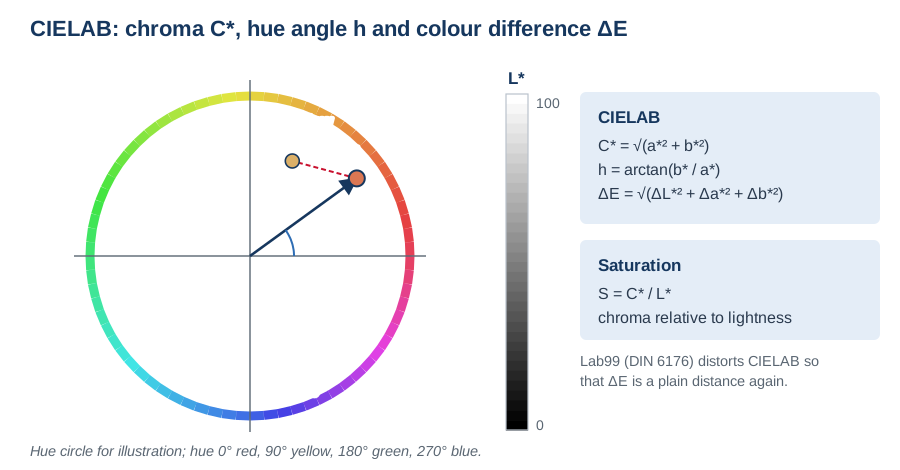
Chroma C* is the distance of a colour from the neutral axis, in CIELAB C*ab = √(a*² + b*²). Saturation S relates it to lightness, S = C*/L*, and describes the colour impression independently of how bright the colour is.
Hue angle h
The hue angle is the polar angle in the a*b* plane: hab = arctan(b*/a*), given from 0 to 360 degrees – 0° red, 90° yellow, 180° green, 270° blue. It separates hue from lightness and chroma. Close to the neutral axis it becomes indeterminate: at very low chroma it fluctuates strongly without the colour impression changing.
Object colours: CIELAB, Lab99 and ΔE
For the colours of surfaces rather than light sources, the CIELAB space serves with L* for lightness, a* for red versus green and b* for yellow versus blue; it requires a reference white, usually D65 or D50. The colour difference ΔE is the distance between two points in it: ΔE*ab Euclidean, ΔE00 after CIEDE2000 with weighting functions. The DIN99 space of DIN 6176 distorts CIELAB so that the plain Euclidean distance ΔE99 is perceptually uniform again. Which formula applies must be stated – the same two colours give different numbers depending on it.
Measuring and looking up colorimetric quantities
Colorimetric quantities cannot be determined with a broadband radiometer. They require the complete spectrum, because each of them is a different weighting of that same spectrum – an instrument that delivers a single number cannot tell them apart. Which instruments can is covered under spectroradiometer or broadband radiometer; the spectra of common lamps can be compared in the spectral database explorer.
The glossary below shows the colorimetric part of the collection. The remaining groups – radiometric, photometric, weighted – are in the full glossary of optical quantities.
Frequently asked questions about colorimetric quantities
Colour temperature T applies only to sources whose chromaticity lies exactly on the Planckian locus — in practice only thermal radiators. For all others the correlated colour temperature Tn is quoted: the temperature of the Planckian radiator at the smallest distance in the CIE 1960 UCS diagram. How far off the locus the chromaticity sits is stated by Δuv — without that value a CCT figure is incomplete.
Because the cones are not distributed evenly across the retina: the eye sees differently in a central two-degree field than across ten degrees. The CIE captured both cases in separate sets of colour matching functions — CIE 1931 for 2°, CIE 1964 for 10°. For broadband sources the difference is small, for narrow-band LED spectra considerable. Chromaticities from different observers must not be compared.
Because Ra is the average over eight weakly saturated test colours; saturated red is not among them. That is what the special index R9 is for, and for white LEDs with a weak red component it can drop below 20 without Ra collapsing. Anyone judging colours asks for R9, R13 and R15 as well — or for Rf and Rg after IES TM-30 straight away.
A spectroradiometer. Chromaticity, colour temperature and colour rendering indices are weightings of the complete spectrum; a broadband instrument delivers a single number and cannot tell them apart. What also matters is the spectral resolution — it has to be smaller than the spacing of the lines to be separated — and a traceable calibration.