

The UV LED spot source simulation by Opsytec Dr. Gröbel calculates the beam profile and irradiance (mW/cm²) of the UV LED point sources solo P, Spot P and Spot P short directly in your browser. Choose the product and optics (Standard, High Power or Parallel Beam), set the wavelength (365–450 nm) and the working distance, and instantly get the distribution as a heatmap, a 3D view and cross-section profiles.
The calculation is a radiative transfer computation through the optics (backward ray tracing) with simplified assumptions, calibrated to the irradiance profiles of the product datasheets. Results can be exported as CSV files and as a PDF simulation report. The calculated values are indicative data for product selection; binding irradiance levels should be verified by measurement, e.g. with an Opsytec radiometer.
Model: deterministic radiative transfer through the optics (backward ray tracing, E = Σ L·cosθ·dΩ) with simplified assumptions, calibrated to the irradiance profiles of the product datasheets (385 nm). The target plane is perpendicular to the beam axis at the working distance from the housing front; the overall area is flat at z = 0. Transmission losses of the optics are included as a lump factor; manufacturing tolerances, LED spread and temperature effects are not – indicative values, not measurements.
Model and assumptions of the spot source simulation
The spot sources are computed with a deterministic radiative-transfer calculation through the optics: for every point of the target plane the irradiance is obtained as the radiance integral over the exit aperture of the optics,
Formula: E = Σ L(u, θ) · T · cos θ · ΔΩ
The lines of sight are traced backwards through the optics. The method is noise-free and exactly reproducible; the rotational symmetry of the optics is exploited (computation on radii, synthesis of the grid).
The beam path of each optics option (Standard, High Power, Parallel Beam) is represented by a simplified model with idealised optical surfaces; the LED enters as an extended source with a simplified spatial and angular distribution. The model is calibrated to the irradiance profiles of the product datasheets (385 nm) and converts other wavelengths via the dispersion of the optics. Transmission losses of the optics are included as a lump factor. The radiant flux per wavelength comes from the LED parameterisation; UV-LED solo P is computed with reduced LED power, Spot P short is optically identical to Spot P (shorter housing).
- Indicative simulation — manufacturing tolerances, LED spread/binning and temperature effects are not included
- Reflections at the tube wall are included as specular with a lump reflectance (default 15 %, anodised aluminium at steep angles) up to the third bounce; diffuse scattering is not
- Multi-spot arrangements: all spots identical (product, optics, power), tilt pivot = centre of the front face, no mutual shadowing; summation via a precomputed single-spot field
- Target plane perpendicular to the beam axis (rotationally symmetric calculation); for CAD models the local angle of incidence is taken into account, shadowing is not
Frequently asked questions about the spot source simulation
The simulation is deterministic: a radiative-transfer calculation through the optics, calibrated to the irradiance profiles of the product datasheets at 385 nm. It provides indicative values for product selection and design. Manufacturing tolerances, LED spread and binning, temperature effects and diffuse scattering are not included. Binding irradiance levels should be determined by measurement with a calibrated UV radiometer.
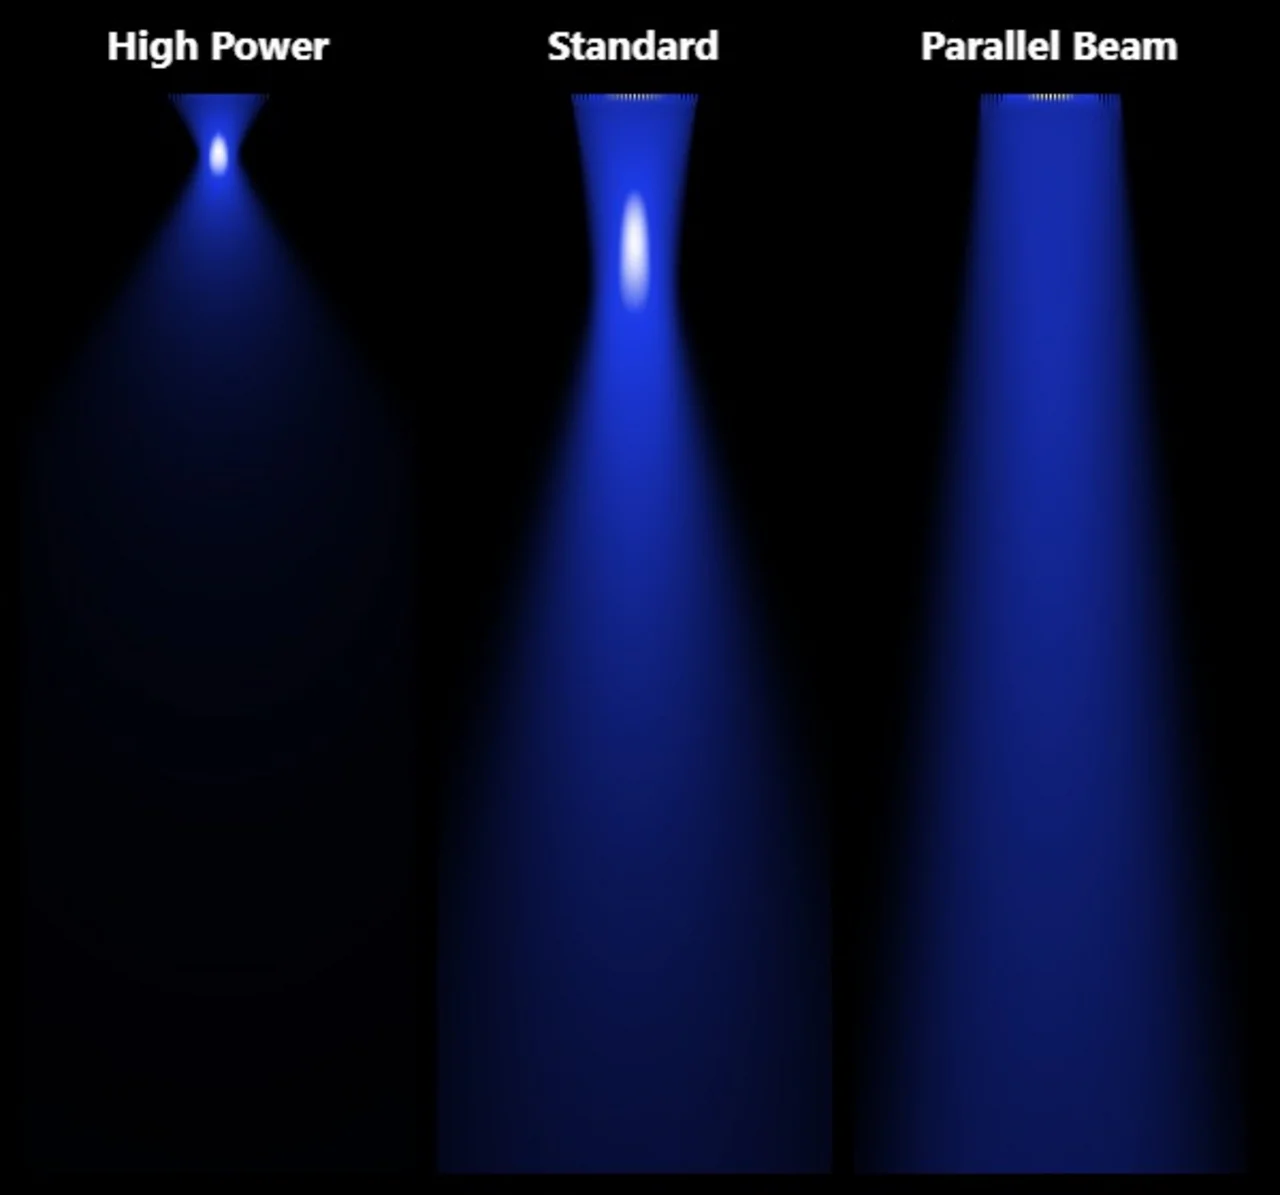
The Standard optics focus the LED radiation into a spot of a few millimetres with best focus at about 15–20 mm working distance. High Power focuses tighter and closer to the front face (about 4–8 mm) and reaches the highest irradiance. Parallel Beam delivers a nearly parallel bundle with lower irradiance but large depth of field for working distances from about 30 mm. The “Beam profile” and “Section view” cards show the comparison as in the datasheet.
The working distance is measured from the front face of the housing to the target plane, which is perpendicular to the beam axis. For STEP or STL models the distance refers to the top edge of the model. The slider sweeps the distance; the key figures show centre irradiance, average, maximum and spot diameter.
Yes. In the “Arrangement” section up to 16 spots can be arranged in a row, square or ring with adjustable spacing and tilt (perpendicular, towards the centre, towards a target point or individually). After “Calculate” the irradiance of all spots is summed; the optimiser improves uniformity via tilt angle, spacing and working distance. The geometry can be exported as a table, a dimensioned top view (PNG) and DXF.
Yes. Load a STEP or STL model; the irradiance is computed per outer face with the local angle of incidence, faces turned away from the spots receive zero, shadowing is not considered. The file is processed entirely locally in your browser and is never uploaded.
The simulation covers 365, 385, 395, 405 and 450 nm. The typical radiant flux of the LED is stored per wavelength and enters the calculation directly; the optics are converted to the selected wavelength via their dispersion.
Author: Dr. Mark Paravia
Dr.-Ing. Mark Paravia is the managing director of Opsytec Dr. Gröbel GmbH in Ettlingen and heads the accredited calibration laboratory. Following his research on pulsed xenon excimer discharges at the Institute of Lighting Technology at KIT, his current focus is on optical radiation measurement technology. He is vice-chair of the DIN Standards Committee FNL 7 “Optical Radiation,” and a member of the DVGW Project Group on UV Disinfection.