


How UV sensors work: design and measurement errors
A UV sensor converts optical radiation into an electrical signal. The reading arises from detector, filter, optics, electronics, calibration and measuring geometry; it is therefore never a property of the detector alone. What matters for the comparability of UV measurements is above all spectral responsivity, cosine response, dynamic range, stray light and the match with the actual source.
This page follows the signal path and shows where measurement errors arise along it. Broadband radiometers and spectroradiometers serve as the two designs in which different error sources show up most clearly. Both terms are common for the angular response: cosine correction refers to the measure taken at the sensor, cosine response to the result.
The measurand: irradiance
Every UV measurement begins with the question of which quantity is to be determined. In industrial practice this is almost always irradiance E in W/m², the radiant power arriving on a surface. Integrated over time, irradiance becomes radiant exposure H in J/m², commonly called the “dose” – the governing quantity in safe UV disinfection as much as in UV curing. The conversion between the two is handled by our radiometry calculator for UV and light.
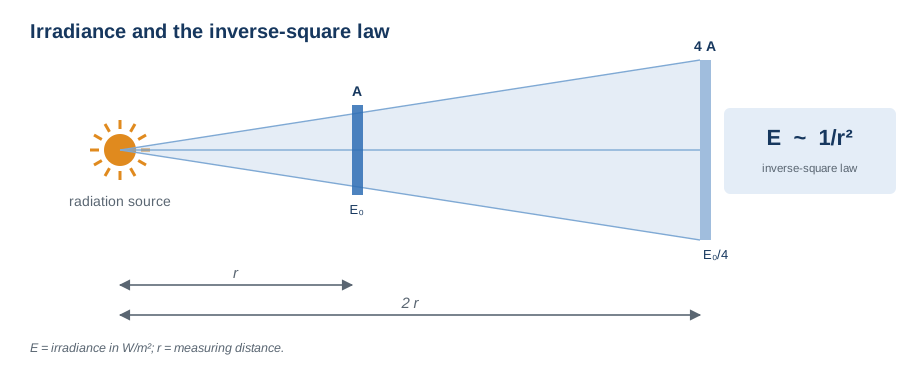
For a point-like source radiating in all directions, the inverse-square law applies: double the measuring distance and the same radiant flux is spread over four times the area, so irradiance drops to a quarter.
This law holds under one condition that is routinely overlooked in practice: the source must be point-like as seen by the sensor. The established rule of thumb is a measuring distance of r ≥ 10 · d, where d is the largest dimension of the emitting surface.
Two further conditions matter just as much: the orientation of the sensor towards the source, and the question of which spectral range is being weighted at all. Both lead directly to the design of the instruments.
The broadband radiometer
A broadband radiometer weights the incoming radiation with a fixed spectral responsivity function s(λ) built into its optics and returns a single number. The measuring head is a stack of optical components, and their order is no accident.
Optical window. Usually fused silica, because ordinary soda-lime glass is effectively opaque below about 300 nm. The window protects the components behind it and seals the head against process media.
Diffuser. It scatters the incoming radiation and thereby creates the cosine-shaped angular response. The diffuser is not an accessory but the component that makes the reading an area-related quantity in the first place.
Filter stack. This is where the actual spectral weighting is created – typically from a combination of interference filters and coloured glass. The stack determines whether the instrument measures UV-A, UV-B, UV-C or an application-specific action spectrum.
Detector. Silicon photodiodes are the standard; for UV-C applications, SiC diodes are increasingly used because they are intrinsically blind in the visible and thereby relieve the filter stack.
A transimpedance amplifier then converts the photocurrent into a voltage, and an A/D converter digitises it. The great advantage of this design: a photocurrent can be measured linearly over many decades. Radiometers therefore achieve a dynamic range that an array spectrometer cannot match – and they are rugged, compact and comparatively inexpensive.
ASTM G130-12(2020) classifies these instruments by the half-width Δλ of their responsivity function into narrow-band radiometers (Δλ ≤ 20 nm), broad-band instruments (20 nm ≤ Δλ ≤ 70 nm) and wide-band instruments (Δλ ≥ 70 nm). This classification is more than terminology: the wider the spectral range, the more strongly the reading depends on the spectrum of the source being measured.

The spectroradiometer
A spectroradiometer disperses the radiation into its spectral components and measures spectral irradiance E(λ) in W/(m²·nm). Any spectral range and any action spectrum can then be derived by calculation from that spectrum – and that is precisely where the versatility of this instrument class lies.
The optical path begins, as in the radiometer, with an input optic, usually a diffuser acting as a cosine receptor. An optical fibre carries the radiation to the entrance slit. A collimating mirror forms a parallel beam that strikes an optical grating. The grating disperses the radiation by wavelength, and a focusing mirror images the resulting spectrum onto a detector array – CCD or CMOS.
Elegant as the principle is, its physical weakness is unforgiving. A grating produces not only the wanted first diffraction order but also higher orders that must be steered out of the beam path. Added to this is scattering at mirrors, mounts and housing surfaces. Both mechanisms deposit long-wave signal components at the position of a short wavelength.

Spectral mismatch – the radiometer's weakness
A broadband radiometer never measures “the UV-A radiation”. It forms a weighted integral of the product of source spectrum and responsivity function. As long as the spectrum of the measured source matches that of the calibration lamp, this is unproblematic. When it differs, the spectral mismatch error appears.
It becomes particularly critical when the emission of the test object falls on a flank of the responsivity curve. Manufacturing tolerances of the filter then translate directly into the reading. This is not a theoretical concern: for a UV-B long-pass filter of type WG320, the 50 % edge may lie anywhere between roughly 314 nm and 326 nm within the manufacturer’s specification. Depending on which specimen is fitted, the same source yields deviations ranging from a few tenths of a percent into the single-digit percent range – without the instrument being “faulty”.
CIE 220:2016 “Characterization and Calibration Methods of UV Radiometers” (prepared by CIE committee TC 2-47) describes a systematic approach. The report carries the quality indices familiar from photometry in ISO/CIE 19476:2014 over to UV radiometers – among them f1′ for spectral mismatch, f2 for angular response, f3 for linearity, plus indices for fatigue, temperature and humidity effects. Because UV radiometers, unlike illuminance meters, are not designed for a single reference illuminant, CIE 220:2016 defines three reference spectra and adds ten real source spectra in its annex – from low- and medium-pressure mercury lamps through xenon and HMI sources to the solar spectrum.
Practical consequence: anyone who knows the spectral responsivity of their radiometer and the spectrum of their source can calculate the mismatch factor and apply it as a correction factor. That does require the manufacturer to state the individually measured relative spectral responsivity and the spectrum of the calibration lamp in the calibration certificate.

Stray light – the spectroradiometer's weakness
Measuring in the UV-C presents a difficulty that seems paradoxical at first: the problem is not the UV, it is everything else. A medium-pressure mercury lamp emits orders of magnitude more power in the visible and near infrared than in the UV-C spectral range. If even a fraction of that power scatters onto the 254 nm channel inside the instrument, an apparent signal arises there that can exceed the real reading. How pronounced this imbalance is for a given lamp is shown by the spectral database explorer.
The orders of magnitude differ dramatically: a double monochromator achieves a relative stray light of about 10⁻⁷ to 10⁻⁹, an array spectrometer lies at 10⁻³ to 10⁻⁵, and a micro-array spectrometer only at 10⁻¹ to 10⁻².
A double monochromator passes the radiation over a grating twice and thereby suppresses stray light by several decades more than a single-stage system. The price is size, measurement time and cost – which is why it is used as a laboratory reference instrument rather than in the field.
The situation is aggravated by the infrared sensitivity of silicon-based detector arrays: they are most sensitive precisely where the interfering radiation is strongest. Without suitable order-sorting filters and a documented stray-light correction, UV-C measurements with compact array spectrometers carry substantial and often unknown uncertainties.

Cosine response
Irradiance is defined as radiant power per unit area – measured on a plane surface. When radiation arrives obliquely, the same flux is spread over a larger area, so the signal must fall as cos θ. A real receptor only approximates this: at large angles of incidence, reflections occur at the interfaces.
The quality index f2 describes the mean deviation from the ideal cosine curve. It is decisive wherever radiation does not arrive perpendicular: in UV disinfection reactors, in irradiation chambers with reflective walls, in web curing. In a chamber with highly reflective walls, the diffuse component can exceed the direct one – a sensor with poor angular response then systematically under-reads.
In practice, the quality of the cosine correction is often apparent from the design alone: from the size and diffusivity of the input optic, and from how far it protrudes beyond the housing edge.

Dynamic range
The sources used in UV technology differ in spectral irradiance by more than seven decades – from the deuterium lamp used as a calibration standard to the 6 kW mercury lamp in a curing line.
A fully digital radiometer covers this range through photocurrent measurement and range switching. An array spectrometer is limited by the full-well capacity of its pixels and by the read-noise floor; it works through integration-time adjustment, which costs measurement time and runs into limits at both ends of the range.
The same distinction applies to the analog-to-digital converter. Its resolution – 12, 16 or 24 bit – determines how finely the reading is displayed and how wide the usable dynamic range is. It says nothing about measurement accuracy: that follows from the calibration and from the spectral match to the source being measured.

Traceability: what a reading is worth
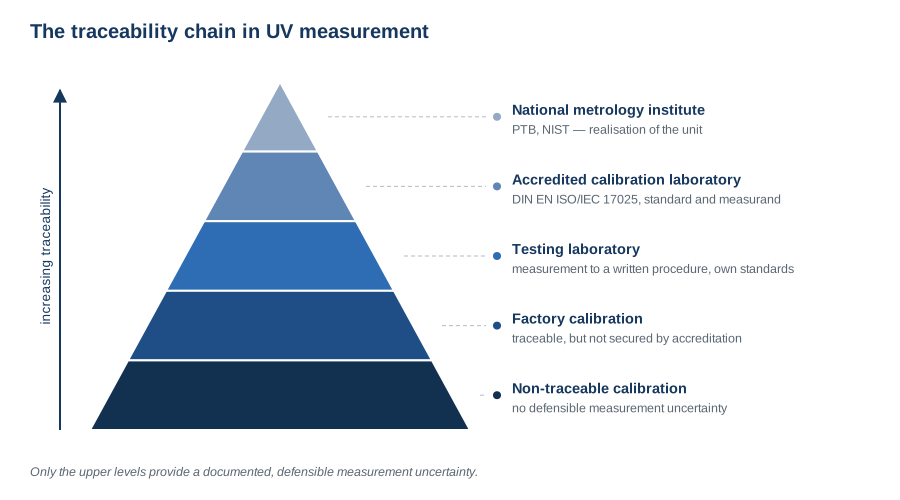
A measured value without traceability is a number without a reference frame. The metrological chain runs from the national metrology institute down to the instrument on the production line – and uncertainty grows at every step.
At the top sits the national metrology institute – PTB in Germany, NIST in the United States – which realises the unit. Below it follows the calibration laboratory accredited to ISO/IEC 17025, which works with its own standards and whose competence is regularly assessed by an accreditation body. Testing laboratories measure to a written procedure. A factory calibration may well be traceable, but it is not secured by independent assessment. At the very bottom stands the non-traceable calibration: it delivers reproducible numbers, but no defensible measurement uncertainty.
The calibration transfer in practice
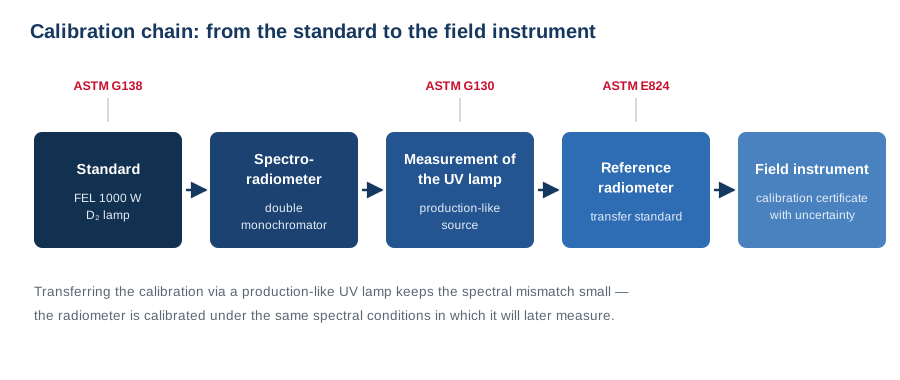
The usual route begins at a spectral standard – a 1000 W FEL lamp for the UV-A and visible range, a deuterium lamp for the short-wave range. A spectroradiometer is calibrated against this standard (ASTM G138-12(2020)e1). The calibrated spectroradiometer then measures a production-like UV lamp – that is, a source spectrally as similar as possible to the eventual measurement object. The reference radiometer is calibrated against that lamp (ASTM G130-12(2020)), and from there the calibration is finally transferred to the field instruments (ASTM E824-26).
The trick lies in the third step: by using a production-like lamp as the transfer source, the radiometer is calibrated under the same spectral conditions in which it will later measure. Spectral mismatch – the principal error source of the broadband radiometer – is thereby largely eliminated. This is precisely why a properly calibrated broadband radiometer can outperform a spectroradiometer in accuracy for a known lamp type.
Two lamp families serve the calibration itself: line sources, such as low-pressure mercury lamps, for wavelength calibration, and continuum sources – deuterium and tungsten-halogen lamps – for spectral responsivity calibration. Halogen lamps demand particular care, because their strong long-wave output is scattered inside the instrument and, uncorrected, produces exactly the stray-light error one is trying to measure.
For measurement uncertainty this means: the calibration certificate does not merely supply a factor, it also defines the source and the geometry for which that factor holds. The further the measurement departs from those conditions, the larger the contribution of the calibration to the overall uncertainty. How calibration works in detail is set out under the UV calibration procedure.
Measurement uncertainty
CIE 250:2022 “Spectroradiometric Measurement of Optical Radiation Sources” (CIE TC 2-80) is the current reference text for spectroradiometric measurements in the range from 200 nm to 2500 nm. It replaces the almost forty-year-old CIE 063-1984 and gives a detailed account of the physical effects to be considered when estimating measurement uncertainty.
In practice a characteristic pattern emerges: the smallest achievable measurement uncertainty is largest in the short-wave UV and decreases towards longer wavelengths. Typical values for accredited calibrations are around 6 % in the range near 200–230 nm, about 3.5 % in the UV-B and UV-A, and just under 3 % in the visible range (expanded measurement uncertainty, k = 2). The reasons for this pattern are physical: lower radiance of the standards, stronger stray-light effects, and the greater sensitivity of optical materials to ageing and contamination.

Which sensor type when
Each of the two designs has exactly one dominant error source, and the two are complementary: spectral mismatch for the broadband radiometer, stray light for the spectroradiometer. The selection follows from that:
- If the lamp type is known and stays constant, a suitably calibrated broadband radiometer delivers the smaller measurement uncertainty – with wider dynamic range, shorter response time and greater ruggedness.
- If the source changes, is unknown, or an action spectrum has to be evaluated, there is no way around the spectral measurement.
- In many installations the combination is the best solution: spectral verification at longer intervals, continuous process monitoring by broadband measurement.
The full side-by-side comparison, criterion by criterion, is given under choosing a broadband radiometer or a spectroradiometer.
Standards and further reading
| Document | Content |
|---|---|
| CIE 220:2016 | Characterization and calibration of UV radiometers; quality indices, reference spectra, mismatch calculation |
| CIE 250:2022 | Spectroradiometric measurement of optical radiation sources, 200–2500 nm; measurement uncertainty |
| ISO/CIE 19476:2014 | Characterization of illuminance and luminance meters; basis of the quality-index system |
| ASTM G138-12(2020)e1 | Calibration of a spectroradiometer against an irradiance standard |
| ASTM G130-12(2020) | Calibration of narrow- and broad-band UV radiometers using a spectroradiometer |
| ASTM E824-26 | Transfer of calibration from reference to field radiometers |
| DIN EN ISO/IEC 17025:2018-03 | Requirements for the competence of testing and calibration laboratories |
Frequently asked questions
Why does a UV-C measurement need special care?
Because most UV sources emit orders of magnitude more power in the visible and the infrared than in the UV-C – and silicon-based detectors are most sensitive in exactly that range. Stray light inside the instrument can therefore produce an apparent UV-C signal larger than the real one.
What is spectral mismatch?
The error that arises when the spectrum of the measured source differs from the spectrum of the lamp used to calibrate the instrument. CIE 220:2016 describes how to quantify it and how to apply it as a correction factor.
At what distance from the lamp should measurements be taken?
Far enough for the source to behave as a point source as seen by the sensor – as a rule of thumb, at least ten times its largest dimension. Measurements at shorter distances remain valid readings, but must not be scaled to other distances using the inverse-square law.
Why does the calibration certificate matter so much?
Because it states the calibration source, the spectral responsivity and the measurement uncertainty. Without those three, a reading cannot be compared with a limit value, with another instrument, or with an earlier measurement.
How does temperature change the irradiance?
Temperature acts on both sides of the measurement: the photodiode and the filters of a sensor are temperature-dependent, more strongly in the UVC than in the UVA, and mercury lamps as well as UV LEDs change both radiant power and peak wavelength with operating temperature. Reproducible values therefore require a defined operating temperature and a fixed, documented distance.
Checklist for the measuring chain
Six questions decide whether a UV reading is dependable:
- Does the spectral responsivity match the emission of the source and the intended weighting function?
- Is directed or spatially distributed radiation being measured, and does the angular response suit it?
- Does the reading sit safely inside the measuring range and dynamic range?
- Can secondary wavelengths or stray light distort the result?
- Does the calibration refer to a sufficiently similar source and geometry?
- Is the measurement uncertainty small enough for the process limit?
Find the right sensor
Find the right sensor: The UV Sensor Finder proposes the three best-matching UV sensors and meters by application, wavelength and form factor – with key values, system partner and reasons.
Spectroradiometer and sensors for UV measurement
UVpad

Flat spectral radiometer, 14.4 mm high, for conveyor systems, 200 to 440 nm with 2 nm bandwidth.

SR900

Array spectroradiometer for 200 to 1100 nm with integrating spheres, cosine diffuser and probes as accessories.
Radiometer RMD Pro
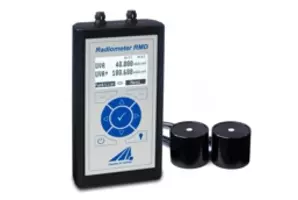
All-digital handheld radiometer for irradiance and dose with two sensor inputs and 8 GB memory.
curelog

Flat radiometer and dosimeter that travels through UV conveyor systems at up to 2000 readings/s, in up to four spectral ranges.
PLC.D – digital UV sensors
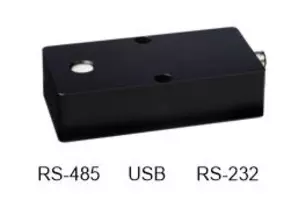
Digital UV and light sensors with RS-485, RS-232 or USB for direct connection to the PLC.