ISR900 Pro – the spectroradiometer for automated measurements
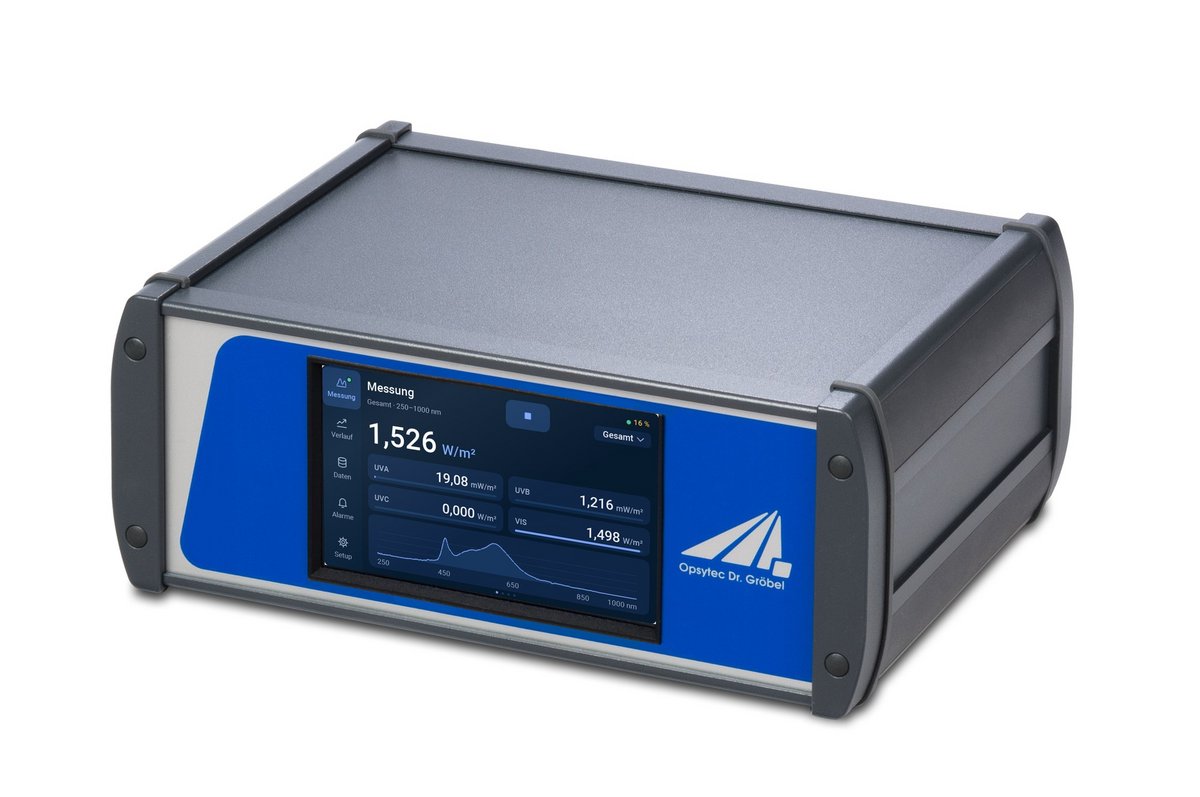
The ISR900 Pro is a stand-alone spectroradiometer for UV, VIS and NIR for the automated monitoring of optical radiation in industrial processes. It captures spectra from 200 to 1100 nm, calculates 77 measured quantities from them and shows the spectrum, measured values and trend on a 5-inch touch display – without a PC. Four monitors with pre-alarm and alarm, a pass/fail test, Modbus TCP/RTU and four switching outputs integrate it directly into test stands and production lines.
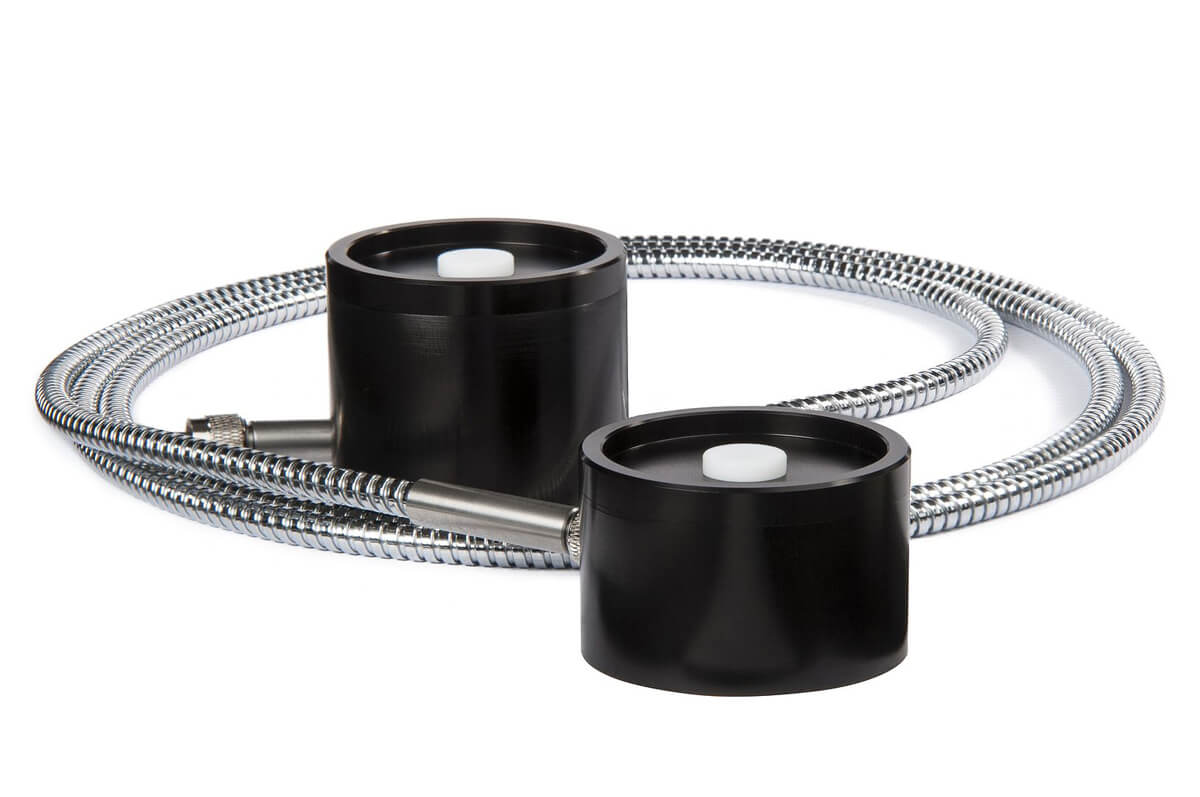
The radiation reaches the device through a quartz optical fiber with SMA 905 connector. Three radiometry sets with measuring heads of 35, 25 and 10 mm height are available. The calibration is traceable to the PTB and covers 220 to 1000 nm. The spectrometer is the same as in the laboratory instrument SR900; the ISR900 Pro adds its own operation, evaluation and interfaces.
Spectral measurement from 200 to 1100 nm
The ISR900 Pro captures the spectral distribution of optical radiation from the UV through visible light into the near infrared. The built-in array spectrometer has 2048 pixels with 16-bit resolution and a spectral bandwidth of 2.3 nm (FWHM). It captures 200 to 1100 nm; the calibrated range is 220 to 1000 nm, traceable to the Physikalisch-Technische Bundesanstalt (PTB), the German national metrology institute.
The device sets the integration time itself according to the strength of the source. A factory-stored dark library – the dark signal of the detector for all integration times from 0.01 ms to 10 s – handles the dark correction, so the input does not have to be covered before each measurement.
From the spectrum, the device calculates radiometric, photometric, colorimetric and action-weighted quantities. When a spectroradiometer is worthwhile compared with a broadband radiometer is explained on the page Spectroradiometer or broadband radiometer.
Measuring without a PC: touch display and views
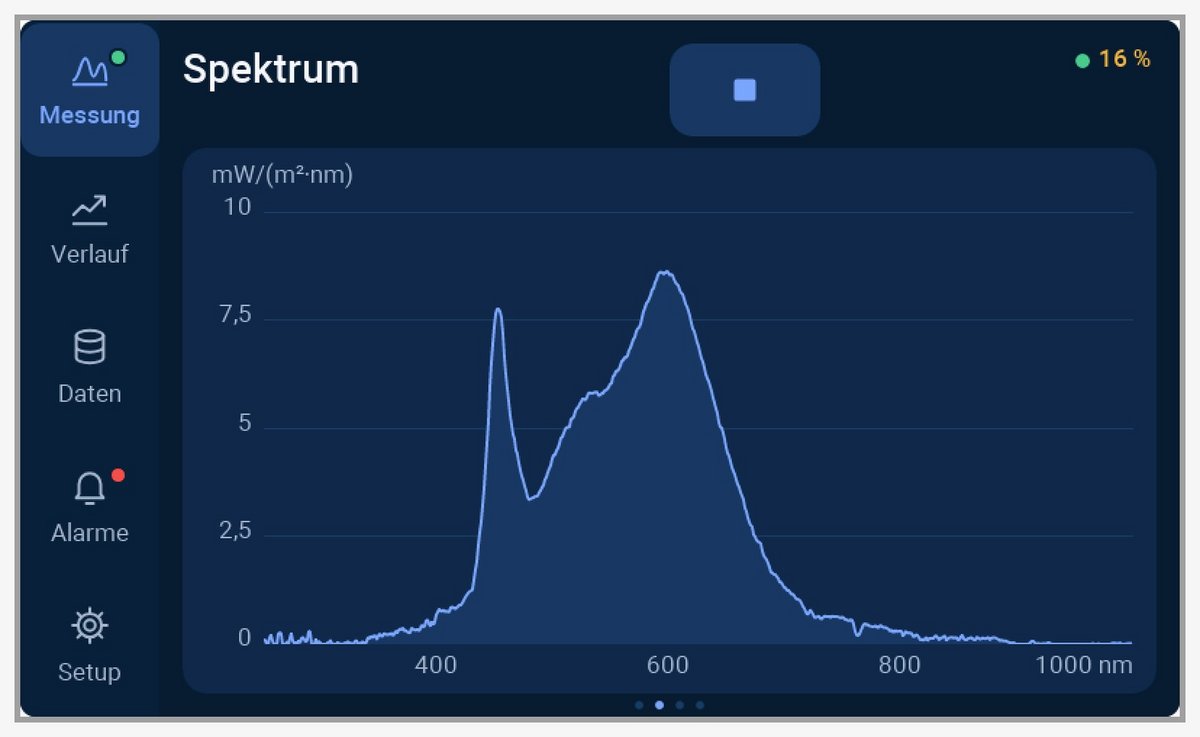
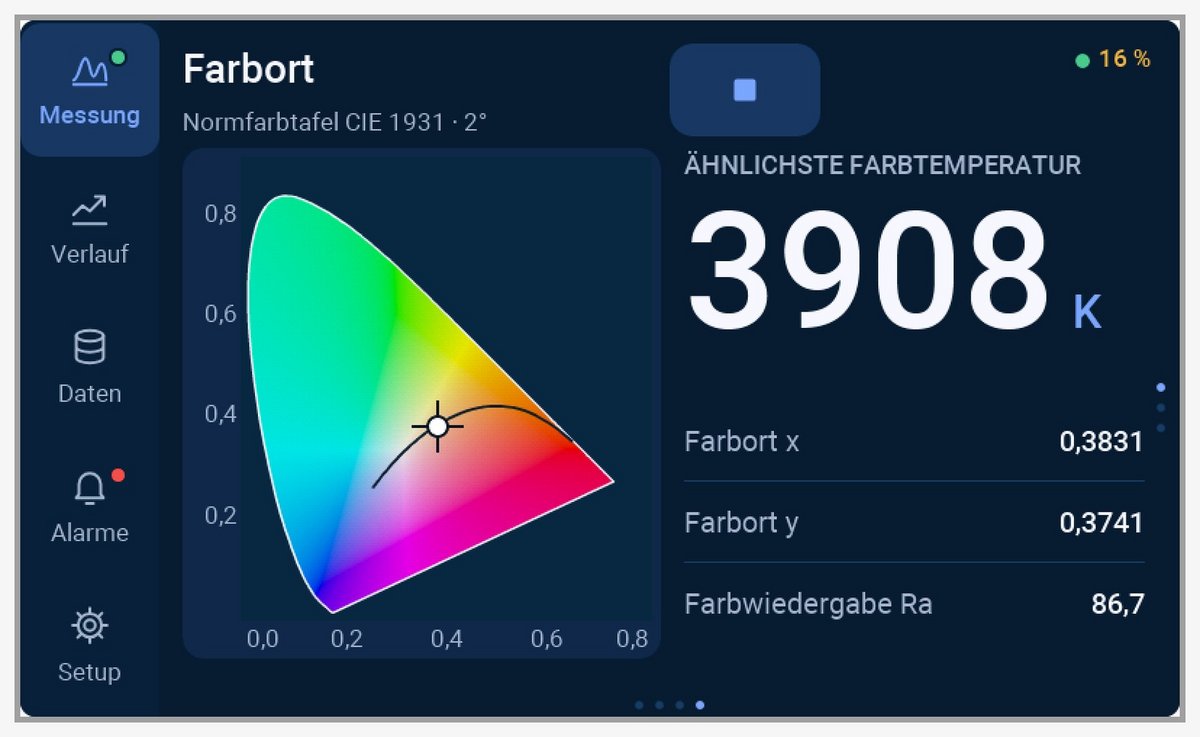
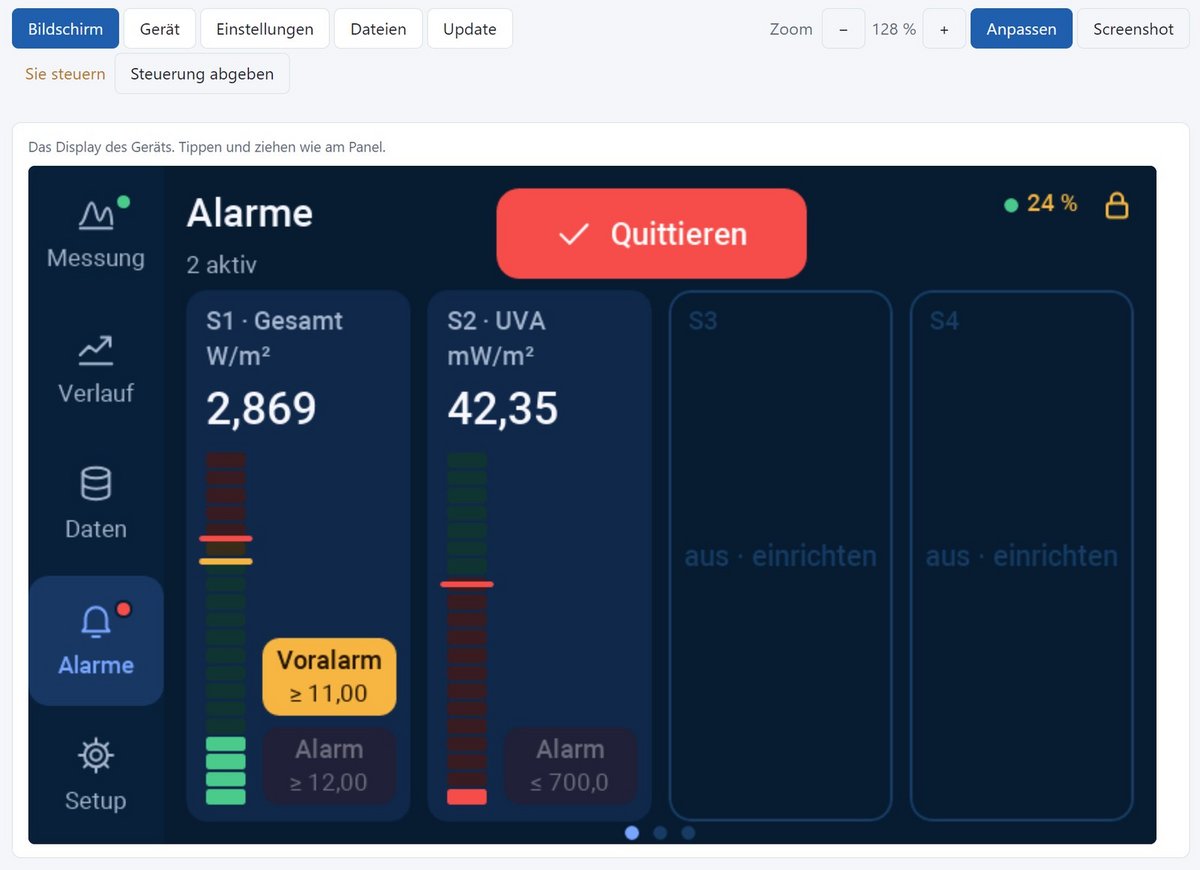
The ISR900 Pro is operated via a capacitive 5-inch color touch display with 800 × 480 pixels. Measurements can be started, evaluated and saved on the device. Besides a large main value, the measurement view shows four further measured quantities; in addition there are the spectrum, the trend of the last two hours, the chromaticity and the detector level.
Seven views are stored at the factory: Overall, UV curing, UVC disinfection, UV LED, Light & color, Plant lighting and Test. A measurement is triggered continuously, by a key on the display, via a trigger input or by a Modbus command.
| Product type | Spectroradiometer: stand-alone benchtop device 200–1100 nm with touch display, process monitoring and Modbus |
| Spectral range | 200–1100 nm (spectrally resolved), calibrated 220–1000 nm |
| Calibration uncertainty (typ.) | 5.0–9.5 % (k = 2) |
| Output / interface | Ethernet (Modbus TCP, web interface), RS-485 (Modbus RTU), USB-C, 4 switching outputs, 2 trigger inputs |
| Operation | 5-inch touch display, web interface, SRpro 7 spectral software |
| Calibration | Factory calibration, traceable to the PTB |
| Suitable for | UV curing; UVC disinfection; testing of UV LEDs; light and color; plant lighting; test stands and production lines |
| Not suitable for | VUV measurement at 172 nm; radiation below 200 nm or above 1100 nm |
The calibration uncertainty stated above is the expanded uncertainty of the calibration (k = 2, confidence level about 95 %) and applies to the calibration source and the calibration conditions. The measurement uncertainty in use is larger: in addition, there is the spectral mismatch to the source used, the sensor temperature, aging since calibration as well as distance and alignment to the source. How an uncertainty budget results from this is described under Measurement uncertainty in UV metrology.
Highlights ISR900 Pro spectroradiometer
- Spectroradiometer for UV, VIS and NIR from 200 to 1100 nm
- Measuring without a PC: 5-inch touch display with measured value, spectrum and trend
- 77 measured quantities: irradiances, light color, color rendering, PPFD and photobiological effects
- Calibration traceable to the PTB
- Automatic integration time and dark correction from the factory
- Four monitors with pre-alarm and alarm
- Pass/fail test with up to four criteria
- Modbus TCP and Modbus RTU, four switching outputs, two trigger inputs
- Web interface in the browser
- Measurement series with up to 28,800 measuring points
77 measured quantities for UV metrology, lighting technology and photobiology
From every spectrum, the ISR900 Pro calculates 77 measured quantities. All of them are also available via Modbus and in the export.
- UV metrology: irradiances of UVA, UVB and UVC as well as visible and near-infrared components – for UV lamps, UV LEDs and UV curing systems.
- UVC and disinfection: UVC irradiance and microbicidally weighted quantities based on stored action spectra. They assess the radiation source spectrally; they do not prove the disinfection result itself.
- Light and color: illuminance, correlated color temperature (CCT), color rendering index Ra and R9, chromaticity coordinates.
- Plant lighting: photosynthetic photon flux density (PPFD) and ePAR.
- Photobiology: actinic UV effect, blue light, erythemally effective radiation, UV index and melanopic quantities.
How spectra of LEDs are evaluated from the UV into the near infrared is described on the page LED metrology.
All 77 measured quantities of the ISR900 Pro
| Quantity | Symbol | Unit | Range in nm |
|---|---|---|---|
| Total irradiance (measuring range) | Ee | W/m² | entire measuring range |
| UV-C irradiance | EUVC | W/m² | 200–280 |
| UV-B irradiance | EUVB | W/m² | 280–315 |
| UV-A irradiance | EUVA | W/m² | 315–400 |
| UV-A2 irradiance | EUVA2 | W/m² | 315–340 |
| UV-A1 irradiance | EUVA1 | W/m² | 340–400 |
| Total UV irradiance | EUV | W/m² | 200–400 |
| Visible irradiance | EVIS | W/m² | 380–780 |
| IR-A irradiance (up to the end of the measuring range) | EIRA | W/m² | from 780 to the end of the measuring range |
| Irradiance < 240 nm (ozone-generating) | EO3 | W/m² | start of the measuring range to 240 |
| UV-C fraction | pUVC | % | – |
| UV-B fraction | pUVB | % | – |
| UV-A fraction | pUVA | % | – |
| Visible fraction | pVIS | % | – |
| IR-A fraction | pIRA | % | – |
| Fraction < 240 nm | pO3 | % | – |
| Total irradiance, SRpro 6 rectangle sum* | Ee,L | W/m² | entire measuring range |
| UV-A, SRpro 6 rectangle sum* | EUVA,L | W/m² | 315–400 |
* Only in the export, for comparison with measurement data from older software.
| Quantity | Symbol | Unit | Range in nm |
|---|---|---|---|
| Peak wavelength (parabola through 3 points) | λp | nm | entire measuring range |
| Peak wavelength (pixel of the maximum) | λp,px | nm | entire measuring range |
| Spectral peak value | Eλ,max | W/(m²·nm) | – |
| Centroid wavelength | λc | nm | entire measuring range |
| 50 % wavelength (median) | λ50 | nm | entire measuring range |
| Full width at half maximum | Δλ0,5 | nm | – |
| Quantity | Symbol | Unit | Range in nm |
|---|---|---|---|
| Illuminance | Ev | lx | 360–830 |
| Illuminance with K_m = 683* | Ev | lx | 360–830 |
| Luminous efficacy of radiation of the source | K | lm/W | – |
* Only in the export, for comparison with measurement data from older software.
| Quantity | Symbol | Unit | Range in nm |
|---|---|---|---|
| Photosynthetic photon flux density (PAR) | PPFD | µmol/(m²·s) | 400–700 |
| Photon flux density UV 380–400 | PFDUV | µmol/(m²·s) | 380–400 |
| Photon flux density blue | PFDB | µmol/(m²·s) | 400–500 |
| Photon flux density green | PFDG | µmol/(m²·s) | 500–600 |
| Photon flux density red | PFDR | µmol/(m²·s) | 600–700 |
| Photon flux density far red 700–780 | PFDFR | µmol/(m²·s) | 700–780 |
| Extended PAR (ePAR) | ePFD | µmol/(m²·s) | 400–750 |
| Photon flux density far red (S640) | PFDFR | µmol/(m²·s) | 700–750 |
| Total photon irradiance | Ep | µmol/(m²·s) | entire measuring range |
| Quantity | Symbol | Unit | Range in nm |
|---|---|---|---|
| Tristimulus value X (2°) | X | W/m² | 380–780 |
| Tristimulus value Y (2°) | Y | W/m² | 380–780 |
| Tristimulus value Z (2°) | Z | W/m² | 380–780 |
| Chromaticity coordinate x | x | – | – |
| Chromaticity coordinate y | y | – | – |
| Chromaticity coordinate u (CIE 1960) | u | – | – |
| Chromaticity coordinate v (CIE 1960) | v | – | – |
| Chromaticity coordinate u′ (CIE 1976) | u′ | – | – |
| Chromaticity coordinate v′ (CIE 1976) | v′ | – | – |
| Correlated color temperature | Tcp | K | – |
| Distance to the Planckian locus | Duv | – | – |
| CCT according to McCamy (approximation)* | Tcp | K | – |
| Dominant wavelength (− = complementary) | λd | nm | – |
| Excitation purity | pe | – | – |
| General color rendering index | Ra | – | 360–830 |
| Special color rendering index R9 (saturated red) | R9 | – | – |
| Color difference test–reference (validity of Ra) | DC | – | – |
* Only in the export, for comparison with measurement data from older software.
| Quantity | Symbol | Unit | Range in nm |
|---|---|---|---|
| Chromaticity coordinate x₁₀ | x₁₀ | – | 380–780 |
| Chromaticity coordinate y₁₀ | y₁₀ | – | 380–780 |
| u′₁₀ | u′₁₀ | – | – |
| v′₁₀ | v′₁₀ | – | – |
| Quantity | Symbol | Unit | Range in nm |
|---|---|---|---|
| Actinically effective irradiance | ES | W/m² | 180–400 |
| Permissible duration actinic (30 J/m²) | tmax | s | – |
| Permissible duration UV-A (10⁴ J/m²) | tmax | s | – |
| Blue-light-weighted irradiance (small source) | EB | W/m² | 300–700 |
| Permissible duration blue light (100 J/m²) | tmax | s | – |
| Erythemally effective irradiance | Eer | W/m² | 250–400 |
| Erythemally effective, formula instead of table (built into SRpro 7)* | Eer | W/m² | 250–400 |
| UV index | UVI | – | – |
| Vitamin D effective irradiance | ED | W/m² | 250–400 |
| Melanopically effective irradiance | Emel | W/m² | 380–780 |
| Melanopic equivalent daylight illuminance | Ev,melD65 | lx | – |
| Melanopic daylight efficacy ratio | γmel,vD65 | – | – |
| Microbicidally effective (B. subtilis) | Ebakt | W/m² | 200–400 |
| Microbicidal efficiency (B. subtilis) | η | – | – |
| Microbicidally effective (MS2 phage) | EMS2 | W/m² | 200–300 |
| Microbicidal efficiency (MS2) | η | – | – |
* Only in the export, for comparison with measurement data from older software.
| Quantity | Symbol | Unit | Range in nm |
|---|---|---|---|
| Total radiant exposure (t = 60 s) | He | J/m² | – |
| UV-A radiant exposure (t = 60 s) | HUVA | J/m² | – |
| Actinically effective radiant exposure (t = 60 s) | HS | J/m² | – |
| Erythemally effective radiant exposure (t = 60 s) | Her | J/m² | – |
The radiant exposure is calculated over a fixed time window of 60 s and is available via Modbus and in the export.
Process monitoring and PLC connection: spectroradiometer with Modbus
Four independent monitors each assess one measured quantity against limit values, each with pre-alarm and alarm, adjustable delay and acknowledgment. A test plan combines up to four criteria with AND or OR; the result is pass or fail and is counted.
For the connection to a plant control system (PLC), Modbus TCP via Ethernet and Modbus RTU via a galvanically isolated RS-485 interface are available, also both at the same time. Via Modbus, measured quantities, device states and settings can be read, and measurement and control commands can be sent.
In addition, there are four galvanically isolated 24 V switching outputs for PLC inputs (maximum 25 mA per output) and two galvanically isolated 24 V trigger inputs. The outputs signal, for example, pre-alarm, alarm, pass/fail or the operating state; the inputs trigger single measurements and test sequences or acknowledge alarms.
Web interface, USB-C and SRpro 7 spectral software
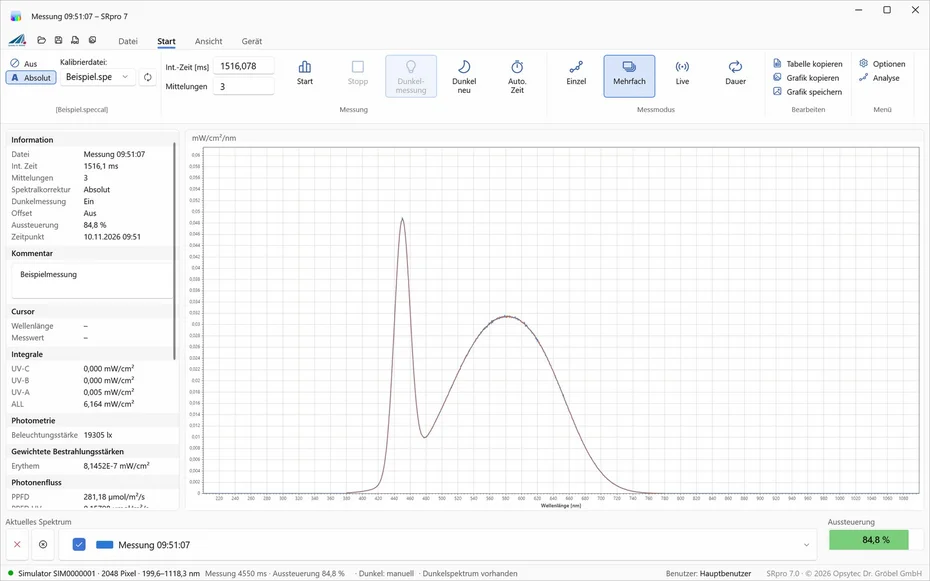
In the local network, the built-in web interface shows the display in the browser. If enabled, the device can be operated and configured there; measurement files and firmware updates are also handled through it. The web interface and Modbus TCP are switched off at the factory.
Via USB-C, the device can be shared with a PC as a drive; there, the stored measurement series are available as CSV and the spectra in .spec format. For laboratory evaluation, reports and loading calibration files, the SRpro 7 spectral software is available, connected via USB or LAN.
PIN-protected settings, a device password and an internal error log secure operation.
Measurement series and long-term recording
Besides single measurement and live display, the ISR900 Pro records measurement series with up to 28,800 measuring points – for example eight hours at one-second intervals or around 200 days at ten-minute intervals. Up to 64 data sets can be stored in the device. The export is used for statistical evaluation, documentation of tests and tracking the aging of radiation sources.
Technical data ISR900 Pro spectroradiometer
| Device type | Stand-alone array spectroradiometer, benchtop device |
| Spectral range | 200–1100 nm |
| Calibrated range | 220–1000 nm, traceable to the PTB |
| Calibration uncertainty (typ.) | 5.0–9.5 % (k = 2) |
| Spectral bandwidth (FWHM) | 2.3 nm |
| Pixel spacing | 0.44 nm |
| Detector | Si array, 2048 pixels |
| Resolution | 16 bit |
| Integration time | automatically controlled |
| Dark correction | dark library from the factory |
| Measured quantities | 77 |
| Display | 5 inch, capacitive color touch display, 800 × 480 pixels |
| Measuring mode | continuous, single measurement, trigger or Modbus |
| Monitoring | 4 independent monitors with pre-alarm and alarm |
| Test plan | up to 4 criteria, AND/OR logic, pass/fail with counter |
| Switching outputs | 4 × 24 V, galvanically isolated, for PLC inputs (max. 25 mA per output) |
| Trigger inputs | 2 × 24 V, galvanically isolated |
| Interfaces | Ethernet, RS-485 (galvanically isolated), USB-C |
| Protocols | Modbus TCP and Modbus RTU, also simultaneously |
| Web interface | display view, operation, settings, files, firmware update |
| Measurement series | up to 28,800 measuring points |
| Device memory | 64 data sets |
| Data export | CSV, .spec |
| PC software | SRpro 7 (USB or LAN) |
| Optical input | 1 × SMA 905 for quartz optical fiber |
| Radiometry sets | measuring head Ø 40 mm, height 35, 25 or 10 mm, quartz optical fiber 1.5 m |
| Housing | benchtop housing 2 U, approx. 250 × 109 × 189 mm (W × H × D, without connectors) |
| Power supply | 230 V AC, IEC inlet, power switch on the rear panel |
ISR900 Pro and SR900 compared
| Feature | ISR900 Pro | SR900 |
|---|---|---|
| Use | test stand, production line and laboratory, without a PC | laboratory, with a PC |
| Operation and display | 5-inch touch display on the device, web interface | on the PC with the SRpro spectral software |
| Evaluation | in the device: 77 measured quantities, monitoring, pass/fail test | in SRpro on the PC |
| Process integration | Modbus TCP and RTU, 4 switching outputs, 2 trigger inputs (24 V) | – |
| Interfaces | Ethernet, RS-485, USB-C | USB 2.0 |
| Spectral range | 200–1100 nm | 200–1100 nm |
| Spectral bandwidth (FWHM) | 2.3 nm | 2.3 nm |
| Detector | Si array, 2048 pixels, 16 bit | Si array, 2048 pixels, 16 bit |
| Calibration | factory calibration, traceable to the PTB | factory calibration, traceable to the PTB |
| Optical input | SMA 905, radiometry sets 35, 25 or 10 mm | SMA 905, radiometry sets 35, 25 or 10 mm |
| Versions | standard | standard, high-power |
| Housing | benchtop housing 2 U, approx. 250 × 109 × 189 mm | 177 × 125 × 45 mm, 0.6 kg |
| Power supply | 230 V AC | 5 V via USB |
Experience the ISR900 Pro as an interactive 3D model
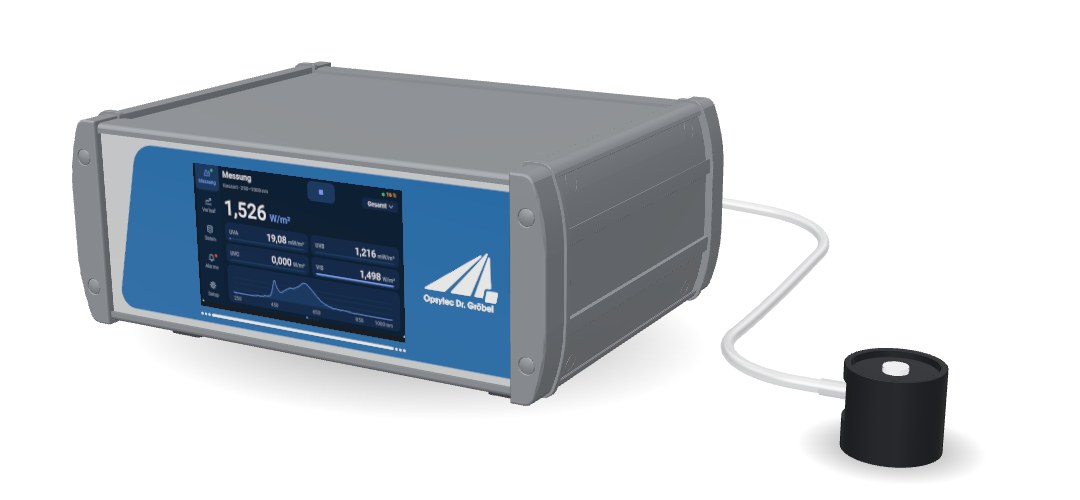
View the housing, optical fiber and sensor head from all sides and tap the touch display – true to the original from the CAD data.
The ISR900 Pro can be viewed from all sides in the 3D product viewer – true to the original from the CAD design data, with optical fiber and selectable sensor head. The touch display shows real screens of the device; a tap switches between measurement, trend, data, alarms and setup.
The housing data are available below in the downloads as a STEP file.
Frequently asked questions: ISR900 Pro
A spectrometer captures the spectral distribution of radiation. The ISR900 Pro is additionally radiometrically calibrated and calculates physical quantities such as irradiance, illuminance and action-weighted quantities from the spectrum. It comes with its own operation, monitoring and the interfaces to the plant control system.
Both use the same array spectrometer with 200 to 1100 nm, 2.3 nm bandwidth (FWHM) and 2048 pixels. The SR900 is a laboratory instrument that is operated via USB on a PC and evaluated with the SRpro spectral software. The ISR900 Pro measures and evaluates on its own, shows the results on a 5-inch touch display and can be integrated into test stands and plants via Modbus TCP/RTU, switching outputs and trigger inputs.
Yes. Measurement, display of measured values and spectra, monitoring and tests run in the device. A PC is not required for measuring. The SRpro 7 software or the web interface are used for laboratory evaluations and for loading calibration files.
Optical radiation from 200 to 1100 nm is captured. The calibration traceable to the PTB covers 220 to 1000 nm. The device thus measures in the UV, in the visible range and in part of the near infrared.
Yes. Four monitors with pre-alarm and alarm, a test plan with pass/fail result, four switching outputs and two trigger inputs allow automatic measurement and test sequences. The device communicates with the plant control system via Modbus TCP or Modbus RTU.
It calculates 77 quantities from the spectrum, including the irradiances of the UV ranges, illuminance, color temperature, color rendering, PPFD, ePAR as well as photobiological and microbicidally weighted quantities. All of them are available via Modbus and in the export.
The calibration certificate states the expanded calibration uncertainty with k = 2; for the ISR900 Pro it is typically 5.0–9.5 %. In ongoing operation, the measurement uncertainty is larger because spectral mismatch to the source used, sensor temperature, aging and measuring geometry are added. How an uncertainty budget results from this is described under Measurement uncertainty in UV metrology.
Order numbers, scope of delivery, accessories and versions
| Device | Order number |
|---|---|
| ISR900 Pro | 840500 |
To measure, the ISR900 Pro needs one of the three radiometry sets with optical fiber and measuring head. Please select the desired set in your inquiry.
| Version | Order number |
|---|---|
| Radiometry set 35 mm (type 1) | 840311 |
| Radiometry set 25 mm (type 2) | 840311-1 |
| Radiometry set 10 mm (type 3) | 840311-2 |
Each set consists of a quartz optical fiber (1.5 m) and a radiometric measuring head (Ø 40 mm). Set 2 corresponds to set 1 with a lower height. Set 3 is the flat measuring head and about half as sensitive as sets 1 and 2.